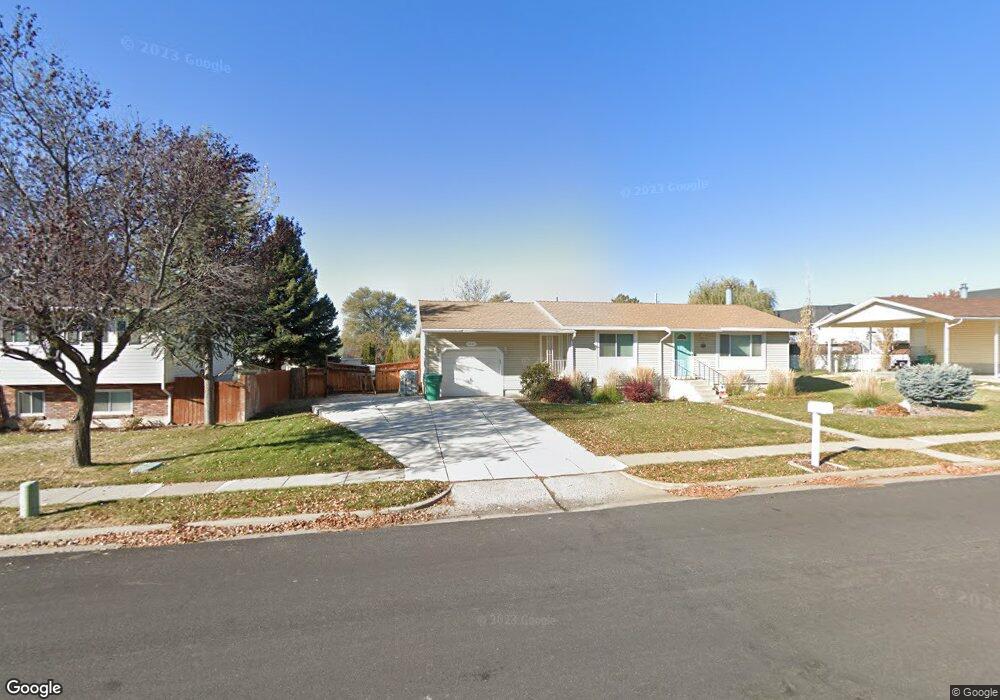
2219 N 1100 W Layton, UT 84041
Estimated Value: $403,000 - $439,372
4
Beds
2
Baths
1,812
Sq Ft
$232/Sq Ft
Est. Value
About This Home
This home is located at 2219 N 1100 W, Layton, UT 84041 and is currently estimated at $421,093, approximately $232 per square foot. 2219 N 1100 W is a home located in Davis County with nearby schools including Lincoln Elementary School, North Layton Junior High School, and Northridge High School.
Ownership History
Date
Name
Owned For
Owner Type
Purchase Details
Closed on
Jul 29, 2025
Sold by
Johnson Christian R
Bought by
Johnson Christian R and Johnson Mackenzie L
Current Estimated Value
Purchase Details
Closed on
Dec 27, 2017
Sold by
Correa Eric G and Correa Michelle
Bought by
Johnson Christian R
Home Financials for this Owner
Home Financials are based on the most recent Mortgage that was taken out on this home.
Original Mortgage
$344,000
Interest Rate
3.95%
Mortgage Type
Commercial
Purchase Details
Closed on
Sep 22, 2017
Sold by
Correa Correa K and Correa Eric
Bought by
Correa Eric G and Correa Karin Michele
Purchase Details
Closed on
Aug 30, 2000
Sold by
Turner Lester K and Turner Patricia Ann
Bought by
Correa Eric and Michele Correa K
Home Financials for this Owner
Home Financials are based on the most recent Mortgage that was taken out on this home.
Original Mortgage
$122,811
Interest Rate
8.2%
Mortgage Type
FHA
Create a Home Valuation Report for This Property
The Home Valuation Report is an in-depth analysis detailing your home's value as well as a comparison with similar homes in the area
Home Values in the Area
Average Home Value in this Area
Purchase History
| Date | Buyer | Sale Price | Title Company |
|---|---|---|---|
| Johnson Christian R | -- | Prospect Title Insurance Agenc | |
| Johnson Christian R | -- | Founders Title | |
| Correa Eric G | -- | -- | |
| Correa Eric | -- | Bonneville Title Company Inc |
Source: Public Records
Mortgage History
| Date | Status | Borrower | Loan Amount |
|---|---|---|---|
| Previous Owner | Johnson Christian R | $344,000 | |
| Previous Owner | Correa Eric | $122,811 |
Source: Public Records
Tax History Compared to Growth
Tax History
| Year | Tax Paid | Tax Assessment Tax Assessment Total Assessment is a certain percentage of the fair market value that is determined by local assessors to be the total taxable value of land and additions on the property. | Land | Improvement |
|---|---|---|---|---|
| 2024 | $1,982 | $209,551 | $116,837 | $92,714 |
| 2023 | $2,001 | $373,000 | $139,920 | $233,080 |
| 2022 | $2,065 | $209,000 | $73,674 | $135,326 |
| 2021 | $1,842 | $278,000 | $102,544 | $175,456 |
| 2020 | $1,664 | $241,000 | $86,619 | $154,381 |
| 2019 | $1,685 | $239,000 | $82,576 | $156,424 |
| 2018 | $1,510 | $215,000 | $82,576 | $132,424 |
| 2016 | $1,188 | $87,285 | $26,501 | $60,784 |
| 2015 | $1,234 | $86,020 | $26,501 | $59,519 |
| 2014 | $1,042 | $74,331 | $26,501 | $47,830 |
| 2013 | -- | $77,237 | $18,612 | $58,625 |
Source: Public Records
Map
Nearby Homes
- 781 W 2150 N
- 2402 N 725 W
- 2378 N 675 W
- 1606 W 1960 N
- 2211 N 525 W
- 1094 N Angel St W
- 1413 W 1650 N
- 1665 W 1960 N
- 1615 N Angel St Unit E
- 1615 N Angel St Unit H
- 1615 N Angel St Unit I
- 1615 N Angel St Unit F
- 1615 N Angel St Unit G
- 1615 N Angel St
- 1615 N Angel St Unit D
- 1615 N Angel St Unit C
- 1615 N Angel St Unit B
- 1615 N Angel St Unit A
- 2187 N 450 W
- 1500 N Angel St Unit 12
- 2233 N 1100 W
- 2205 N 1100 W
- 2222 N 1150 W
- 2206 N 1150 W
- 2220 N 1100 W
- 2234 N 1100 W
- 2206 N 1100 W
- 1113 Spring Creek Dr
- 1119 Spring Creek Dr
- 1080 W 2200 N
- 2224 N 1150 W
- 1127 Spring Creek Dr
- 2223 N 1050 W
- 1111 W 2200 N
- 1073 W 2250 N
- 1121 W 2200 N
- 1133 Spring Creek Dr
- 1091 W 2200 N
- 1065 W 2250 N
- 1149 W 2200 N