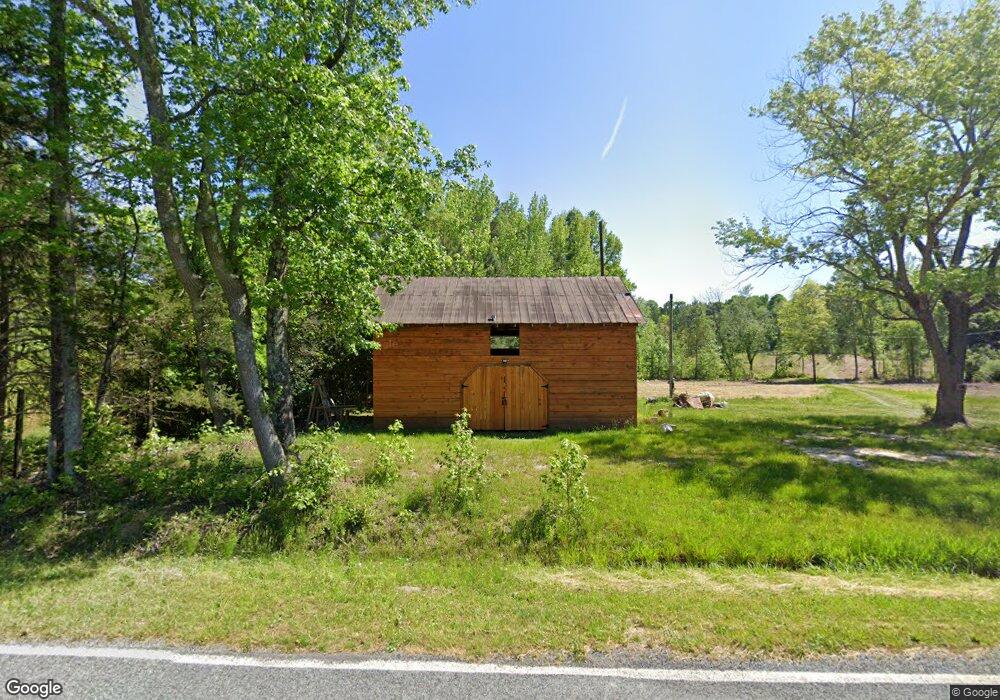
2219 Quakenbush Rd Snow Camp, NC 27349
Estimated Value: $152,141 - $154,000
--
Bed
--
Bath
--
Sq Ft
8.6
Acres
About This Home
This home is located at 2219 Quakenbush Rd, Snow Camp, NC 27349 and is currently estimated at $153,071. 2219 Quakenbush Rd is a home located in Alamance County with nearby schools including Sylvan Elementary School, Southern Alamance Middle School, and Southern Alamance High School.
Ownership History
Date
Name
Owned For
Owner Type
Purchase Details
Closed on
Nov 27, 2024
Sold by
Florence Joshua Kaleb
Bought by
Lashley Joel and Lashley Tina
Current Estimated Value
Home Financials for this Owner
Home Financials are based on the most recent Mortgage that was taken out on this home.
Original Mortgage
$103,600
Outstanding Balance
$98,190
Interest Rate
6.44%
Mortgage Type
New Conventional
Estimated Equity
$54,881
Purchase Details
Closed on
Jun 29, 2020
Sold by
Payne Natasha D and Payne Michael Joseph
Bought by
Florence Joshua Kaleb
Home Financials for this Owner
Home Financials are based on the most recent Mortgage that was taken out on this home.
Original Mortgage
$500,000
Interest Rate
3.2%
Mortgage Type
Future Advance Clause Open End Mortgage
Create a Home Valuation Report for This Property
The Home Valuation Report is an in-depth analysis detailing your home's value as well as a comparison with similar homes in the area
Home Values in the Area
Average Home Value in this Area
Purchase History
| Date | Buyer | Sale Price | Title Company |
|---|---|---|---|
| Lashley Joel | $148,000 | None Listed On Document | |
| Lashley Joel | $148,000 | None Listed On Document | |
| Florence Joshua Kaleb | $57,000 | None Available |
Source: Public Records
Mortgage History
| Date | Status | Borrower | Loan Amount |
|---|---|---|---|
| Open | Lashley Joel | $103,600 | |
| Closed | Lashley Joel | $103,600 | |
| Previous Owner | Florence Joshua Kaleb | $500,000 |
Source: Public Records
Tax History Compared to Growth
Tax History
| Year | Tax Paid | Tax Assessment Tax Assessment Total Assessment is a certain percentage of the fair market value that is determined by local assessors to be the total taxable value of land and additions on the property. | Land | Improvement |
|---|---|---|---|---|
| 2025 | $598 | $100,699 | $96,379 | $4,320 |
| 2024 | $560 | $100,699 | $96,379 | $4,320 |
| 2023 | $520 | $100,699 | $96,379 | $4,320 |
| 2022 | $687 | $89,037 | $89,037 | $0 |
| 2021 | $695 | $89,037 | $89,037 | $0 |
| 2020 | $678 | $89,037 | $89,037 | $0 |
| 2019 | $681 | $89,037 | $89,037 | $0 |
| 2018 | $0 | $89,037 | $89,037 | $0 |
| 2017 | $598 | $89,037 | $89,037 | $0 |
| 2016 | $404 | $59,832 | $59,832 | $0 |
| 2015 | $402 | $59,832 | $59,832 | $0 |
| 2014 | $372 | $59,832 | $59,832 | $0 |
Source: Public Records
Map
Nearby Homes
- 8024 Bird Dog Dr
- 2900 Quakenbush Rd
- 0 Major Hill Rd
- 1515 Alta Vista Ln
- 1475 Alta Vista Ln
- 1507 Alta Vista Ln
- 1499 Alta Vista Ln
- 9650 Twisted Oak Trail
- 0 Bethel South Fork Rd Unit 1194534
- 0 Bethel South Fork Rd Unit 10121921
- 7962 Sylvan Rd
- 4018 Moon Lindley Rd
- 8205 Old Switchboard Rd
- 8245 Old Switchboard Rd
- 6933 Big Woods Rd
- ESSEX Plan at Cane Creek
- DAVIDSON Plan at Cane Creek
- KINGSTON Plan at Cane Creek
- DUPONT Plan at Cane Creek
- 6530 Treetop Ct
- 2219 Quakenbush Rd
- 3 Quakenbush Rd
- 00 Quakenbush Rd
- 2183 Quakenbush Rd
- 0 Quakenbush Rd Unit 1941964
- 0 Quakenbush Rd Unit 2148299
- 0 Quakenbush Rd Unit 1786532
- 0 Quakenbush Rd Unit 930562
- 0 Quakenbush Rd Unit 56673
- 0 Quakenbush Rd Unit 46383
- 0 Quakenbush Rd Unit 51423
- 0 Quakenbush Rd Unit 42371
- 0 Quakenbush Rd Unit 614168
- 0 Quakenbush Rd Unit 703210
- 0 Quakenbush Rd Unit 848607
- 0 Quakenbush Rd Unit 861341
- 0 Quakenbush Rd Unit 902156
- 0 Quakenbush Rd Unit 72764
- 0 Quakenbush Rd Unit 74757
- 0 Quakenbush Rd Unit 82934