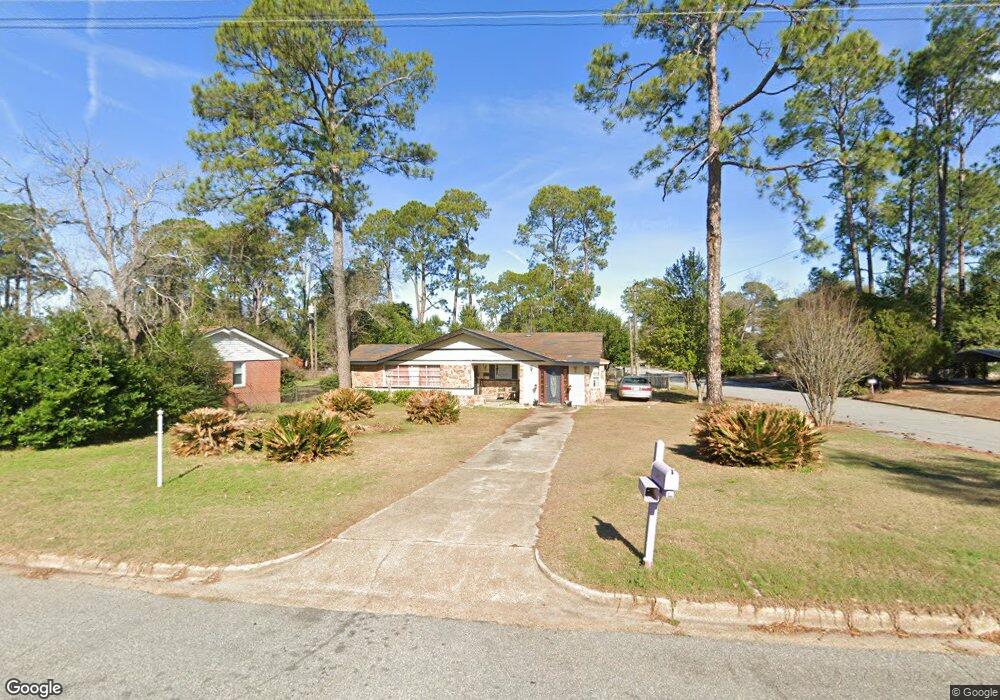
2219 Rosebrier Ave Albany, GA 31705
Estimated Value: $59,000 - $104,000
4
Beds
2
Baths
1,858
Sq Ft
$42/Sq Ft
Est. Value
About This Home
This home is located at 2219 Rosebrier Ave, Albany, GA 31705 and is currently estimated at $77,357, approximately $41 per square foot. 2219 Rosebrier Ave is a home located in Dougherty County with nearby schools including Turner Elementary School, Albany Middle School, and Dougherty Comprehensive High School.
Ownership History
Date
Name
Owned For
Owner Type
Purchase Details
Closed on
Jan 22, 2023
Sold by
Brown Roberson L
Bought by
Emerson Karen
Current Estimated Value
Purchase Details
Closed on
Aug 10, 2016
Sold by
Roberson
Bought by
Brown Roberson
Purchase Details
Closed on
Nov 1, 2011
Sold by
Brown Roberson and Walker Renita
Bought by
Brown Roberson
Purchase Details
Closed on
Aug 26, 2009
Sold by
Walker Joe
Bought by
Walker Renita
Purchase Details
Closed on
Aug 4, 2009
Sold by
Walker Renita
Bought by
Walker Joe
Purchase Details
Closed on
Jul 14, 2009
Sold by
Humphreys Marjorie D
Bought by
Humphreys Marjorie D
Purchase Details
Closed on
Jan 8, 2009
Sold by
Humphreys Majorie D
Bought by
Humphreys Majorie D As Trustee Of The
Purchase Details
Closed on
Feb 26, 2007
Sold by
Young Ben F
Bought by
Young Theresa T
Purchase Details
Closed on
Mar 3, 1967
Sold by
Deejen Derek and Deejen Betty
Bought by
Yong Ben and Yong Theresa
Create a Home Valuation Report for This Property
The Home Valuation Report is an in-depth analysis detailing your home's value as well as a comparison with similar homes in the area
Purchase History
| Date | Buyer | Sale Price | Title Company |
|---|---|---|---|
| Emerson Karen | $55,000 | -- | |
| Brown Roberson | -- | -- | |
| Brown Roberson | -- | -- | |
| Walker Renita | -- | -- | |
| Walker Joe | -- | -- | |
| Walker Renita | $69,900 | -- | |
| Humphreys Marjorie D | -- | -- | |
| Humphreys Majorie D As Trustee Of The | -- | -- | |
| Young Theresa T | -- | -- | |
| Humphreys Marjorie D | $55,000 | -- | |
| Yong Ben | -- | -- |
Source: Public Records
Tax History
| Year | Tax Paid | Tax Assessment Tax Assessment Total Assessment is a certain percentage of the fair market value that is determined by local assessors to be the total taxable value of land and additions on the property. | Land | Improvement |
|---|---|---|---|---|
| 2025 | $802 | $17,840 | $2,360 | $15,480 |
| 2024 | $802 | $17,840 | $2,360 | $15,480 |
| 2023 | $1,045 | $26,400 | $2,360 | $24,040 |
| 2022 | $1,235 | $26,400 | $2,360 | $24,040 |
| 2021 | $1,145 | $26,400 | $2,360 | $24,040 |
| 2020 | $1,147 | $26,400 | $2,360 | $24,040 |
| 2019 | $1,331 | $30,520 | $2,360 | $28,160 |
| 2018 | $0 | $30,520 | $2,360 | $28,160 |
| 2017 | $1,245 | $30,520 | $2,360 | $28,160 |
| 2016 | -- | $30,520 | $2,360 | $28,160 |
| 2015 | $1,250 | $30,520 | $2,360 | $28,160 |
| 2014 | $1,253 | $31,000 | $2,840 | $28,160 |
Source: Public Records
Map
Nearby Homes
- 147 Old Johnson Rd
- 213 Monarch Dr
- 215 Franklin Dr
- 306 Elsom St
- 2539 Crescent Dr
- 410 Johnson Rd
- 2531 Cherokee Dr
- 3625 Sylvester Rd
- 133 Thornton Dr
- 1606 Kieve Ave
- 511 Johnson Rd
- 920 Cordele Rd
- 1521 E Broad Ave
- 608 Cason St
- 811 S Maple St
- 1411 E Gordon Ave
- 148 Force Dr
- 1403 E Waddell Ave
- 2253 Duitman Rd
- 1401 E Waddell Ave
- 2217 Rosebrier Ave
- 2215 Rosebrier Ave
- 2216 Stratford Dr
- 212 Sundale Rd
- 210 Sundale Rd
- 2214 Stratford Dr
- 222 Wright Dr
- 208 Sundale Rd
- 2212 Stratford Dr
- 220 Wright Dr
- 206 Sundale Rd
- 213 S Mock Rd
- 218 Wright Dr
- 2210 Stratford Dr
- 204 Sundale Rd
- 211 S Mock Rd
- 2215 Stratford Dr
- 209 S Mock Rd
- 216 Wright Dr
- 2213 Stratford Dr
Your Personal Tour Guide
Ask me questions while you tour the home.