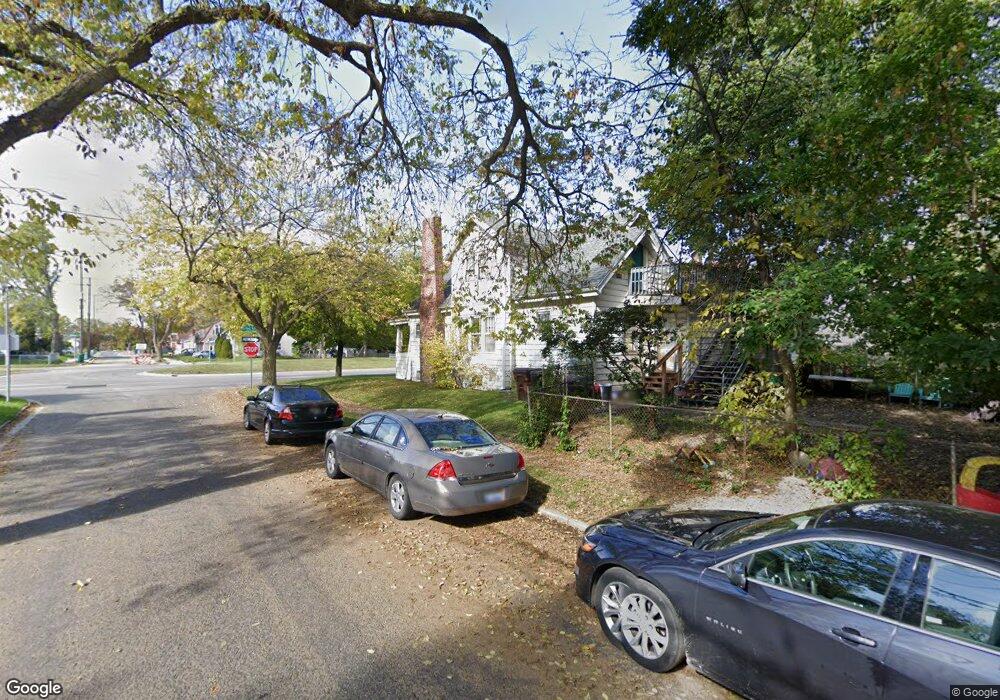
2219 S Mlk Blvd Lansing, MI 48910
Greencroft Park NeighborhoodEstimated Value: $149,723 - $174,000
--
Bed
--
Bath
1,513
Sq Ft
$105/Sq Ft
Est. Value
About This Home
This home is located at 2219 S Mlk Blvd, Lansing, MI 48910 and is currently estimated at $158,931, approximately $105 per square foot. 2219 S Mlk Blvd is a home located in Ingham County with nearby schools including Averill Elementary School, Attwood School, and J.W. Sexton High School.
Ownership History
Date
Name
Owned For
Owner Type
Purchase Details
Closed on
Aug 19, 2016
Sold by
Ohre Rechell Lillian
Bought by
King Jr Lauther Boulevard and Nathaniel Jonathan
Current Estimated Value
Purchase Details
Closed on
Jul 28, 2010
Sold by
Romarios Property Llc
Bought by
Ohare Raechel Lillian and Case Clifford C
Purchase Details
Closed on
Jul 16, 2009
Sold by
Averill Angela Catherine
Bought by
Federal Home Loan Mortgage Corp
Purchase Details
Closed on
Aug 31, 2005
Sold by
Barber Robert C
Bought by
Averill Angela Catherine
Home Financials for this Owner
Home Financials are based on the most recent Mortgage that was taken out on this home.
Original Mortgage
$80,100
Interest Rate
9.42%
Mortgage Type
Fannie Mae Freddie Mac
Create a Home Valuation Report for This Property
The Home Valuation Report is an in-depth analysis detailing your home's value as well as a comparison with similar homes in the area
Home Values in the Area
Average Home Value in this Area
Purchase History
| Date | Buyer | Sale Price | Title Company |
|---|---|---|---|
| King Jr Lauther Boulevard | -- | None Available | |
| Ohare Raechel Lillian | $35,000 | Parks Title | |
| Federal Home Loan Mortgage Corp | $30,000 | None Available | |
| Averill Angela Catherine | $90,200 | Bell Title Company | |
| Barber Robert C | -- | Bell Title Co |
Source: Public Records
Mortgage History
| Date | Status | Borrower | Loan Amount |
|---|---|---|---|
| Previous Owner | Averill Angela Catherine | $80,100 |
Source: Public Records
Tax History Compared to Growth
Tax History
| Year | Tax Paid | Tax Assessment Tax Assessment Total Assessment is a certain percentage of the fair market value that is determined by local assessors to be the total taxable value of land and additions on the property. | Land | Improvement |
|---|---|---|---|---|
| 2025 | $2,724 | $68,500 | $5,500 | $63,000 |
| 2024 | $21 | $62,800 | $5,500 | $57,300 |
| 2023 | $2,555 | $54,700 | $5,500 | $49,200 |
| 2022 | $2,304 | $50,300 | $7,000 | $43,300 |
| 2021 | $2,256 | $46,300 | $5,300 | $41,000 |
| 2020 | $2,242 | $41,600 | $5,300 | $36,300 |
| 2019 | $3,768 | $38,600 | $5,300 | $33,300 |
| 2018 | $2,015 | $35,700 | $5,300 | $30,400 |
| 2017 | $1,929 | $35,700 | $5,300 | $30,400 |
| 2016 | $3,346 | $35,100 | $5,300 | $29,800 |
| 2015 | $3,346 | $33,500 | $10,576 | $22,924 |
| 2014 | $3,346 | $32,500 | $10,576 | $21,924 |
Source: Public Records
Map
Nearby Homes
- 2112 Stirling Ave
- 2011 S Martin Luther King jr Blvd
- 2310 Stirling Ave
- 2001 S Martin Luther King Junior Blvd
- 1032 Kelsey Ave
- 1120 Kelsey Ave
- 2118 Marion Ave
- 907 Lenore Ave
- 2421 Stirling Ave
- 1913 Stirling Ave
- 2515 S Martin Luther King Junior Blvd
- 815 Woodbine Ave
- 2313 S Rundle Ave
- 1420 Poxson Ave
- 1404 Kelsey Ave
- 1114 Goodrich St
- 1312 W Mount Hope Ave
- 712 Lenore Ave
- 1315 Goodrich St
- 1116 George St
- 2219 S Mlk
- 2219 S Mlk
- 2219 S Martin Luther King jr Blvd
- 2217 S Martin Luther King jr Blvd
- 2217 S Mlk Blvd
- 2213 S Mlk Blvd
- 1032 Gordon Ave
- 2301 S Mlk Blvd
- 2301 S Martin Luther King jr Blvd
- 2301 S Martin Luther
- 2301 S Martin Luther King
- 1028 Gordon Ave
- 2305 S Mlk Blvd
- 2205 S Mlk Blvd
- 1033 Gordon Ave
- 1033 Poxson Ave
- 1024 Gordon Ave
- 2309 S Mlk Blvd
- 2201 S Mlk Blvd