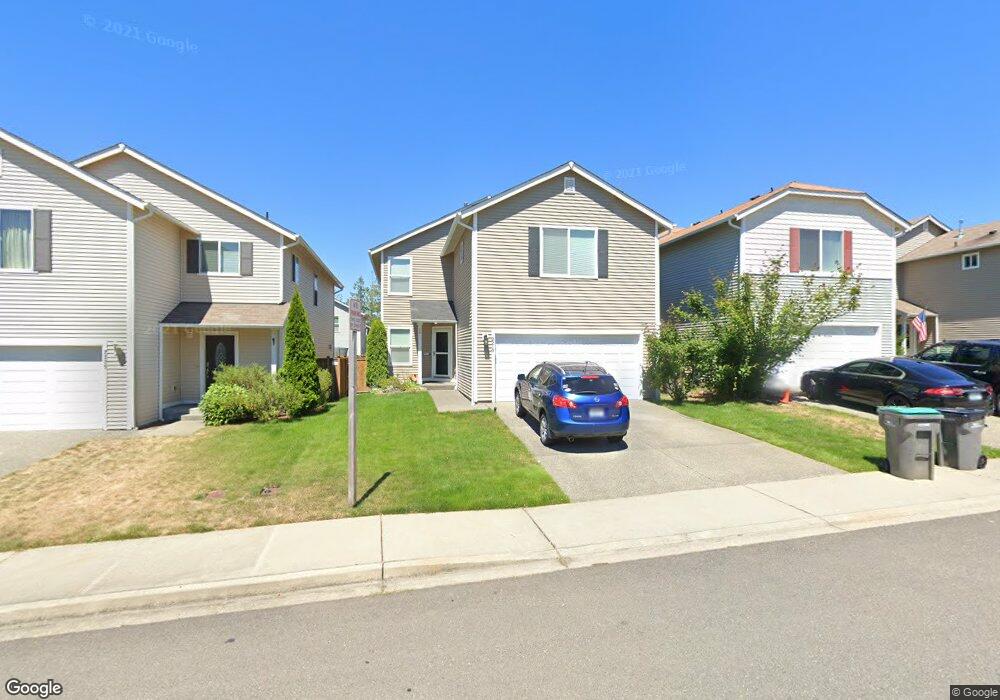
2219 SW Grebe Way Port Orchard, WA 98367
McCormick Woods NeighborhoodEstimated Value: $498,558 - $519,000
3
Beds
3
Baths
2,128
Sq Ft
$238/Sq Ft
Est. Value
About This Home
This home is located at 2219 SW Grebe Way, Port Orchard, WA 98367 and is currently estimated at $506,640, approximately $238 per square foot. 2219 SW Grebe Way is a home located in Kitsap County with nearby schools including Sunnyslope Elementary School, Cedar Heights Middle School, and South Kitsap High School.
Ownership History
Date
Name
Owned For
Owner Type
Purchase Details
Closed on
Aug 11, 2010
Sold by
Secretary Of Veterans Affairs
Bought by
Jump Laurence and Jump Andrea
Current Estimated Value
Home Financials for this Owner
Home Financials are based on the most recent Mortgage that was taken out on this home.
Original Mortgage
$194,085
Outstanding Balance
$128,114
Interest Rate
4.51%
Mortgage Type
VA
Estimated Equity
$378,526
Purchase Details
Closed on
Jun 4, 2010
Sold by
Wells Fargo Bank Na
Bought by
The Secretary Of Veteran Affairs
Purchase Details
Closed on
May 20, 2010
Sold by
Salazar Guadalupe and Salazar Frances
Bought by
Wells Fargo Bank Na
Purchase Details
Closed on
Oct 30, 2007
Sold by
The Quadrant Corp
Bought by
Salazar Guadalupe and Salazar Frances
Home Financials for this Owner
Home Financials are based on the most recent Mortgage that was taken out on this home.
Original Mortgage
$265,500
Interest Rate
6.12%
Mortgage Type
Purchase Money Mortgage
Create a Home Valuation Report for This Property
The Home Valuation Report is an in-depth analysis detailing your home's value as well as a comparison with similar homes in the area
Home Values in the Area
Average Home Value in this Area
Purchase History
| Date | Buyer | Sale Price | Title Company |
|---|---|---|---|
| Jump Laurence | $180,000 | First American Title Ins | |
| The Secretary Of Veteran Affairs | -- | First American Title Ins | |
| Wells Fargo Bank Na | $193,886 | First American Title Ins | |
| Salazar Guadalupe | $260,210 | First American Title Ins Co |
Source: Public Records
Mortgage History
| Date | Status | Borrower | Loan Amount |
|---|---|---|---|
| Open | Jump Laurence | $194,085 | |
| Previous Owner | Salazar Guadalupe | $265,500 |
Source: Public Records
Tax History Compared to Growth
Tax History
| Year | Tax Paid | Tax Assessment Tax Assessment Total Assessment is a certain percentage of the fair market value that is determined by local assessors to be the total taxable value of land and additions on the property. | Land | Improvement |
|---|---|---|---|---|
| 2026 | $3,619 | $433,160 | $95,590 | $337,570 |
| 2025 | $3,619 | $414,670 | $94,610 | $320,060 |
| 2024 | $3,493 | $414,670 | $94,610 | $320,060 |
| 2023 | $3,490 | $414,670 | $94,610 | $320,060 |
| 2022 | $3,484 | $348,460 | $85,810 | $262,650 |
| 2021 | $3,404 | $322,730 | $79,210 | $243,520 |
| 2020 | $3,257 | $299,470 | $73,340 | $226,130 |
| 2019 | $2,656 | $267,290 | $63,220 | $204,070 |
| 2018 | $2,960 | $216,710 | $56,370 | $160,340 |
| 2017 | $2,375 | $216,710 | $56,370 | $160,340 |
| 2016 | $2,403 | $202,990 | $52,680 | $150,310 |
| 2015 | $2,320 | $199,240 | $52,680 | $146,560 |
| 2014 | -- | $224,400 | $52,680 | $171,720 |
| 2013 | -- | $201,080 | $47,390 | $153,690 |
Source: Public Records
Map
Nearby Homes
- 3850 Portside Dr
- 4710 Rutherford Cir SW
- 4510 Castleton Rd SW
- 4460 Castleton Rd SW
- 2430 Puget Sound Blvd
- 4715 Olivine Dr SW
- 1566 SW Old Clifton Rd
- 4821 Amherst Way SW
- 4930 Castleton Rd SW
- 3944 McCormick Village Dr
- 3948 McCormick Village Dr
- 3952 McCormick Village Dr
- 3970 McCormick Village Dr
- 3974 McCormick Village Dr
- 3978 McCormick Village Dr
- 3966 McCormick Village Dr
- 3939 McCormick Village Dr
- 3935 McCormick Village Dr
- Powell Plan at Sinclair Ridge at McCormick - Sinclair Ridge
- Asher Plan at Sinclair Ridge at McCormick - Sinclair Ridge
- 2213 SW Grebe Way
- 2225 SW Grebe Way
- 2207 SW Grebe Way
- 2231 SW Grebe Way
- 2519 SW Siskin Cir
- 2513 SW Siskin Cir
- 2201 SW Grebe Way
- 2525 SW Siskin Cir
- 2234 SW Warbler Way
- 2507 SW Siskin Cir
- 4233 Swift Ave SW
- 2531 SW Siskin Cir
- 2195 SW Grebe Way
- 2228 SW Warbler Way
- 4239 Swift Ave SW
- 2537 SW Siskin Cir
- 2189 SW Grebe Way
- 2222 SW Warbler Way
- 4214 Swift Ave SW
- 2229 SW Warbler Way