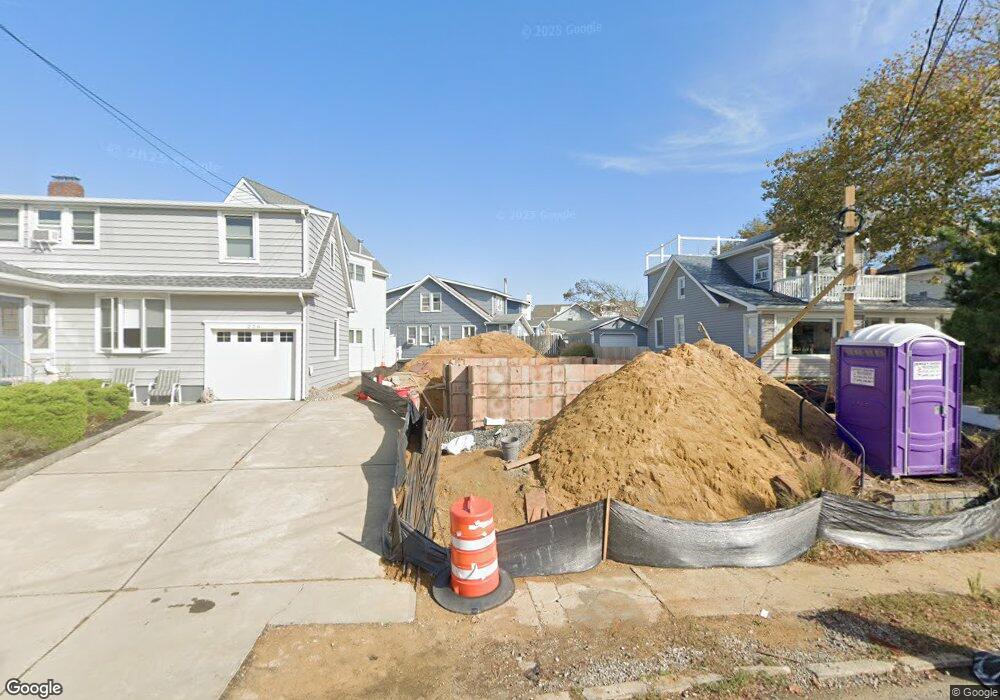
222 19th Ave Unit SUMMER WEEKLY Belmar, NJ 07719
Estimated Value: $780,000 - $1,787,000
3
Beds
2
Baths
1,214
Sq Ft
$925/Sq Ft
Est. Value
About This Home
This home is located at 222 19th Ave Unit SUMMER WEEKLY, Belmar, NJ 07719 and is currently estimated at $1,122,925, approximately $924 per square foot. 222 19th Ave Unit SUMMER WEEKLY is a home located in Monmouth County with nearby schools including Belmar Elementary School, St. Rose Grammar School, and St Rose High School.
Ownership History
Date
Name
Owned For
Owner Type
Purchase Details
Closed on
Jul 28, 2020
Sold by
Sluboski Barbara C and Szlaga Mark T
Bought by
Reddy Scott F and Reddy Stacey K
Current Estimated Value
Home Financials for this Owner
Home Financials are based on the most recent Mortgage that was taken out on this home.
Original Mortgage
$490,000
Interest Rate
2.8%
Mortgage Type
New Conventional
Create a Home Valuation Report for This Property
The Home Valuation Report is an in-depth analysis detailing your home's value as well as a comparison with similar homes in the area
Home Values in the Area
Average Home Value in this Area
Purchase History
| Date | Buyer | Sale Price | Title Company |
|---|---|---|---|
| Reddy Scott F | $612,500 | Oceanview Title Agency Llc | |
| Reddy Scott F | $612,500 | Oceanview Title |
Source: Public Records
Mortgage History
| Date | Status | Borrower | Loan Amount |
|---|---|---|---|
| Previous Owner | Reddy Scott F | $490,000 |
Source: Public Records
Tax History Compared to Growth
Tax History
| Year | Tax Paid | Tax Assessment Tax Assessment Total Assessment is a certain percentage of the fair market value that is determined by local assessors to be the total taxable value of land and additions on the property. | Land | Improvement |
|---|---|---|---|---|
| 2025 | $7,778 | $534,600 | $380,000 | $154,600 |
| 2024 | $7,516 | $534,600 | $380,000 | $154,600 |
| 2023 | $7,516 | $534,600 | $380,000 | $154,600 |
| 2022 | $7,255 | $534,600 | $380,000 | $154,600 |
| 2021 | $7,255 | $485,300 | $380,000 | $105,300 |
| 2020 | $6,527 | $485,300 | $380,000 | $105,300 |
| 2019 | $6,527 | $485,300 | $380,000 | $105,300 |
| 2018 | $5,993 | $485,300 | $380,000 | $105,300 |
| 2017 | $5,848 | $485,300 | $380,000 | $105,300 |
| 2016 | $6,805 | $356,100 | $240,000 | $116,100 |
| 2015 | $6,200 | $336,100 | $220,000 | $116,100 |
| 2014 | $5,867 | $316,100 | $200,000 | $116,100 |
Source: Public Records
Map
Nearby Homes