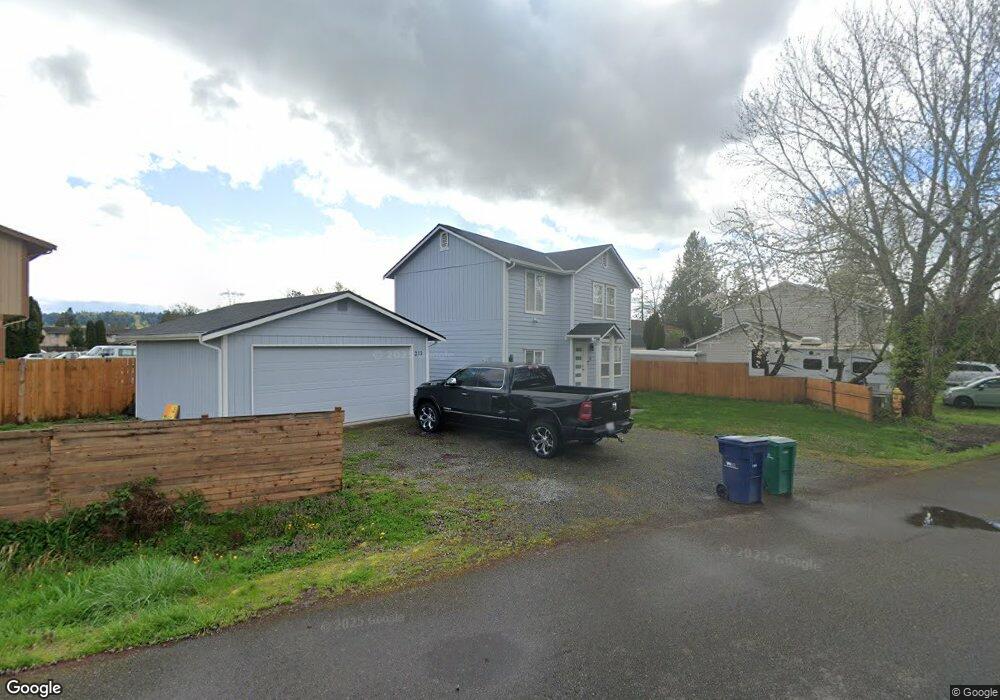
222 3rd Ave SW Pacific, WA 98047
Estimated Value: $475,068 - $1,045,000
Studio
--
Bath
2,464
Sq Ft
$333/Sq Ft
Est. Value
About This Home
This home is located at 222 3rd Ave SW, Pacific, WA 98047 and is currently estimated at $821,689, approximately $333 per square foot. 222 3rd Ave SW is a home located in King County with nearby schools including Alpac Elementary School, Olympic Middle School, and Auburn Riverside High School.
Ownership History
Date
Name
Owned For
Owner Type
Purchase Details
Closed on
May 9, 2019
Sold by
Qualey Paul W
Bought by
Qualey Rentals Llc
Current Estimated Value
Purchase Details
Closed on
Mar 4, 2015
Sold by
Bmp Apartments Llc
Bought by
Qualey Paul W
Home Financials for this Owner
Home Financials are based on the most recent Mortgage that was taken out on this home.
Original Mortgage
$157,500
Interest Rate
3.57%
Purchase Details
Closed on
Jun 3, 2008
Sold by
Qualey Bruce and Qualey Marlene
Bought by
Bmp Apartments Llc
Purchase Details
Closed on
Dec 3, 1998
Sold by
Tani Shirley M
Bought by
Clark Gordon E and Clark Judy A
Home Financials for this Owner
Home Financials are based on the most recent Mortgage that was taken out on this home.
Original Mortgage
$92,750
Interest Rate
6.86%
Mortgage Type
Purchase Money Mortgage
Purchase Details
Closed on
Feb 1, 1984
Sold by
Ferrel Harry L and Ferrel Biolet H
Bought by
Qualey Bruce and Qualey Marlene
Create a Home Valuation Report for This Property
The Home Valuation Report is an in-depth analysis detailing your home's value as well as a comparison with similar homes in the area
Home Values in the Area
Average Home Value in this Area
Purchase History
| Date | Buyer | Sale Price | Title Company |
|---|---|---|---|
| Qualey Rentals Llc | -- | Accommodation | |
| Qualey Paul W | -- | First American | |
| Bmp Apartments Llc | -- | None Available | |
| Clark Gordon E | $115,950 | Evergreen Title Company Inc | |
| Qualey Bruce | $80,000 | -- |
Source: Public Records
Mortgage History
| Date | Status | Borrower | Loan Amount |
|---|---|---|---|
| Previous Owner | Qualey Paul W | $157,500 | |
| Previous Owner | Clark Gordon E | $92,750 |
Source: Public Records
Tax History
| Year | Tax Paid | Tax Assessment Tax Assessment Total Assessment is a certain percentage of the fair market value that is determined by local assessors to be the total taxable value of land and additions on the property. | Land | Improvement |
|---|---|---|---|---|
| 2024 | $6,766 | $594,000 | $125,000 | $469,000 |
| 2023 | $6,345 | $572,000 | $120,000 | $452,000 |
| 2022 | $6,995 | $580,000 | $120,000 | $460,000 |
| 2021 | $6,671 | $557,000 | $100,000 | $457,000 |
| 2020 | $5,699 | $500,000 | $100,000 | $400,000 |
| 2018 | $5,081 | $358,000 | $75,000 | $283,000 |
| 2017 | $5,111 | $339,000 | $75,000 | $264,000 |
| 2016 | $4,471 | $344,000 | $75,000 | $269,000 |
| 2015 | -- | $315,000 | $75,000 | $240,000 |
| 2014 | -- | $234,000 | $75,000 | $159,000 |
| 2013 | -- | $248,000 | $75,000 | $173,000 |
Source: Public Records
Map
Nearby Homes
- 210 Chicago Blvd S
- 322 Chicago Blvd S Unit 8
- 111 4th Ave SW
- 519 Valentine Ave
- 0 W Valley Hwy E Unit NWM2454357
- 412 Algona Blvd S
- 438 Washington Blvd Unit 3
- 36825 52nd Ave S Unit C/D
- 160 Tacoma Blvd
- 36834 48th Ave S
- 204 2nd Ave N
- 215 3rd Ave N
- 5215 S 368th St Unit G/M
- 35804 52nd Ave S
- 37237 42nd Ave S
- 515 4th Ave N
- 11104 8th St E
- 35750 Military Rd S
- 37255 39th Ave S
- 35433 55th Ave S
- 222 3rd Ave SW
- 218 3rd Ave Sw Units 1-4 Unit s 1-4
- 221 Tacoma Blvd S
- 223 Tacoma Blvd S
- 220 3rd Ave SW
- 216 Portland Ct SW
- 218 Portland Ct SW
- 218 Portland Ct SW
- 222 Portland Ct SW
- 222 Portland Ct SW Unit 1 & 2
- 216 3rd Ave SW
- 226 3rd Ave SW
- 224 3rd Ave SW
- 224 3rd Ave SW
- 214 Portland Ct SW
- 226 Portland Ct SW
- 206 Portland Ct SW
- 230 3rd Ave SW
- 212 Portland Ct SW
Your Personal Tour Guide
Ask me questions while you tour the home.