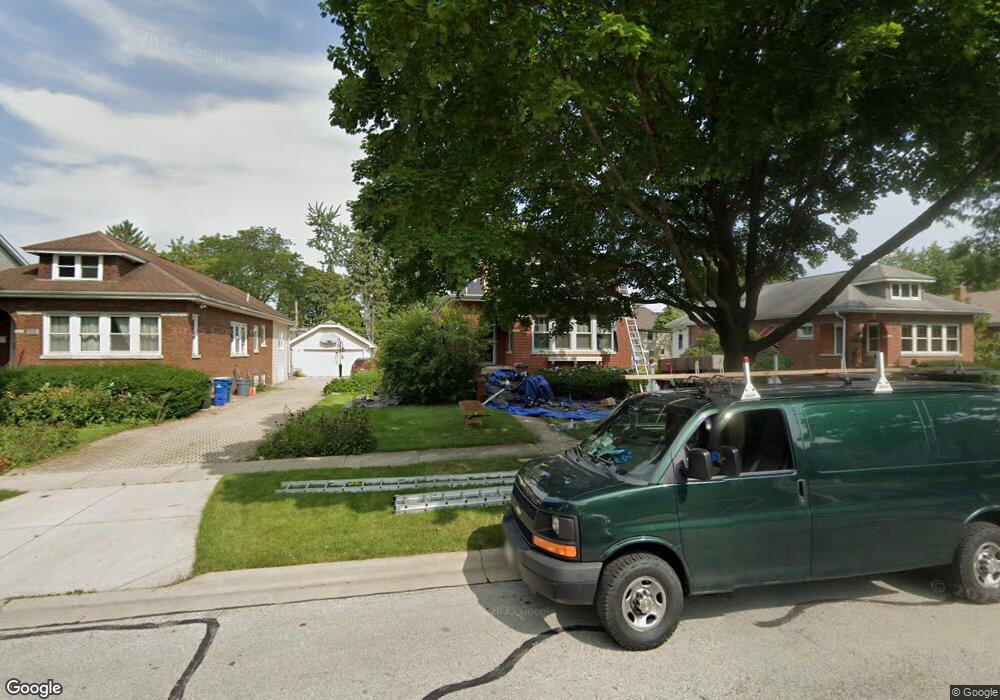
222 3rd St Downers Grove, IL 60515
Estimated Value: $476,000 - $569,000
3
Beds
2
Baths
1,223
Sq Ft
$424/Sq Ft
Est. Value
About This Home
This home is located at 222 3rd St, Downers Grove, IL 60515 and is currently estimated at $518,699, approximately $424 per square foot. 222 3rd St is a home located in DuPage County with nearby schools including Whittier Elementary School, Herrick Middle School, and Downer Grove North High School.
Ownership History
Date
Name
Owned For
Owner Type
Purchase Details
Closed on
Jul 25, 2018
Sold by
Kinsey Philip T and Kinsey Melissa L
Bought by
Kinsey Philip T and Kinsey Melissa L
Current Estimated Value
Purchase Details
Closed on
Nov 10, 2017
Sold by
Hamilton Debra and Lowery Linda A
Bought by
Kinsey Philip T and Kinsey Melissa L
Home Financials for this Owner
Home Financials are based on the most recent Mortgage that was taken out on this home.
Original Mortgage
$125,000
Outstanding Balance
$67,304
Interest Rate
3.25%
Mortgage Type
New Conventional
Estimated Equity
$451,395
Purchase Details
Closed on
Jan 16, 1996
Sold by
Stevens Mark D and Stevens Susan A
Bought by
Hamilton Debra and Lowery Linda A
Home Financials for this Owner
Home Financials are based on the most recent Mortgage that was taken out on this home.
Original Mortgage
$116,900
Interest Rate
7.28%
Create a Home Valuation Report for This Property
The Home Valuation Report is an in-depth analysis detailing your home's value as well as a comparison with similar homes in the area
Home Values in the Area
Average Home Value in this Area
Purchase History
| Date | Buyer | Sale Price | Title Company |
|---|---|---|---|
| Kinsey Philip T | -- | Attorney | |
| Kinsey Philip T | -- | Attorney | |
| Kinsey Philip T | $380,000 | Burnet Title Post Closing | |
| Hamilton Debra | $177,000 | First American Title |
Source: Public Records
Mortgage History
| Date | Status | Borrower | Loan Amount |
|---|---|---|---|
| Open | Kinsey Philip T | $125,000 | |
| Previous Owner | Hamilton Debra | $116,900 |
Source: Public Records
Tax History Compared to Growth
Tax History
| Year | Tax Paid | Tax Assessment Tax Assessment Total Assessment is a certain percentage of the fair market value that is determined by local assessors to be the total taxable value of land and additions on the property. | Land | Improvement |
|---|---|---|---|---|
| 2024 | $7,396 | $137,182 | $63,995 | $73,187 |
| 2023 | $7,021 | $126,110 | $58,830 | $67,280 |
| 2022 | $6,803 | $121,590 | $56,790 | $64,800 |
| 2021 | $6,366 | $120,200 | $56,140 | $64,060 |
| 2020 | $6,247 | $117,820 | $55,030 | $62,790 |
| 2019 | $6,046 | $113,050 | $52,800 | $60,250 |
| 2018 | $5,127 | $95,710 | $52,520 | $43,190 |
| 2017 | $4,672 | $92,100 | $50,540 | $41,560 |
| 2016 | $4,560 | $87,890 | $48,230 | $39,660 |
| 2015 | $4,797 | $82,690 | $45,380 | $37,310 |
| 2014 | $4,796 | $80,400 | $44,120 | $36,280 |
| 2013 | $4,697 | $80,020 | $43,910 | $36,110 |
Source: Public Records
Map
Nearby Homes
- 305 3rd St
- 4947 Wilcox Ave
- 425 Hill St
- 342 Maple Ave
- 5316 Fairview Ave
- 232 55th St
- 4831 Florence Ave
- 5341 Grand Ave
- 543 Burlington Ave Unit 112E
- 243 55th St
- 4946 Douglas Rd Unit 202
- 5518 Wilcox Ave
- 5134 Elmwood Ave
- 5519 Fairview Ave
- 420 Wilson St
- 312 Prairie Ave
- 315 S Park St
- 331 S Park St
- 25 N Washington St
- 302 S Washington St