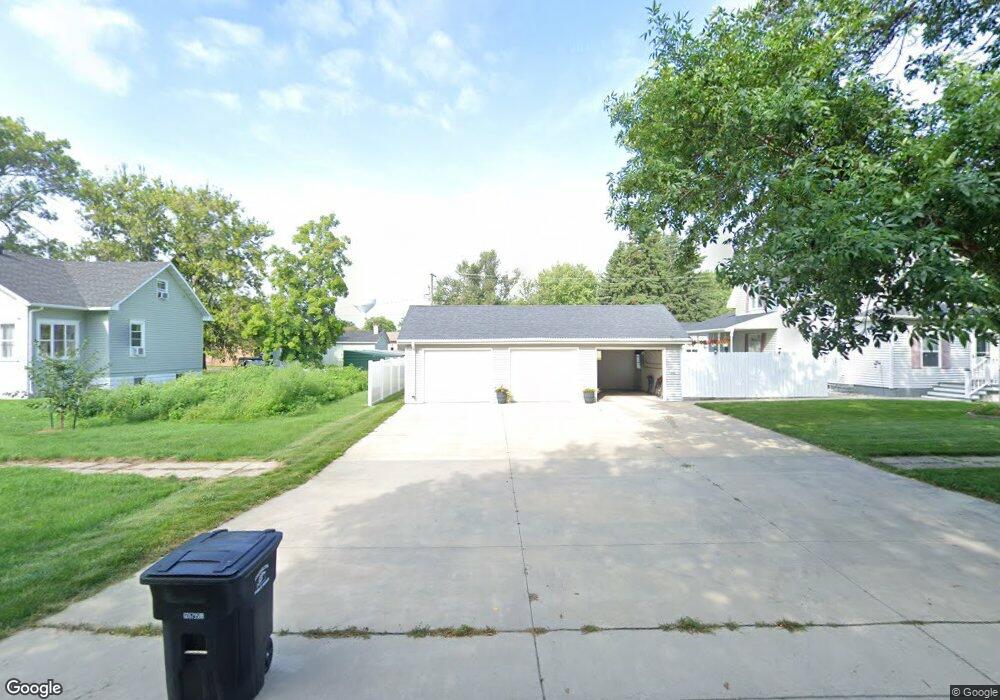
222 4th Ave N Casselton, ND 58012
Estimated Value: $239,000 - $317,000
3
Beds
1
Bath
1,376
Sq Ft
$197/Sq Ft
Est. Value
About This Home
This home is located at 222 4th Ave N, Casselton, ND 58012 and is currently estimated at $270,677, approximately $196 per square foot. 222 4th Ave N is a home located in Cass County with nearby schools including Central Cass Elementary School, Central Cass Middle School, and Central Cass High School.
Ownership History
Date
Name
Owned For
Owner Type
Purchase Details
Closed on
Sep 3, 2010
Sold by
Zimmerman Johnson David B and Zimmerman Johnson Cynthia J
Bought by
Zimmerman Johnson David B and Zimmerman Johnson Cynthia J
Current Estimated Value
Home Financials for this Owner
Home Financials are based on the most recent Mortgage that was taken out on this home.
Original Mortgage
$63,000
Interest Rate
4.54%
Mortgage Type
New Conventional
Purchase Details
Closed on
Jan 31, 2005
Sold by
Idso Dale J and Idso Brenda A
Bought by
Johnson David B
Home Financials for this Owner
Home Financials are based on the most recent Mortgage that was taken out on this home.
Original Mortgage
$60,200
Interest Rate
5.79%
Mortgage Type
New Conventional
Create a Home Valuation Report for This Property
The Home Valuation Report is an in-depth analysis detailing your home's value as well as a comparison with similar homes in the area
Home Values in the Area
Average Home Value in this Area
Purchase History
| Date | Buyer | Sale Price | Title Company |
|---|---|---|---|
| Zimmerman Johnson David B | -- | -- | |
| Johnson David B | -- | -- |
Source: Public Records
Mortgage History
| Date | Status | Borrower | Loan Amount |
|---|---|---|---|
| Closed | Zimmerman Johnson David B | $63,000 | |
| Closed | Johnson David B | $60,200 |
Source: Public Records
Tax History
| Year | Tax Paid | Tax Assessment Tax Assessment Total Assessment is a certain percentage of the fair market value that is determined by local assessors to be the total taxable value of land and additions on the property. | Land | Improvement |
|---|---|---|---|---|
| 2024 | $3,315 | $122,750 | $18,750 | $104,000 |
| 2023 | $3,470 | $114,000 | $18,750 | $95,250 |
| 2022 | $3,191 | $102,650 | $18,750 | $83,900 |
| 2021 | $3,023 | $95,100 | $18,750 | $76,350 |
| 2020 | $2,655 | $88,250 | $18,750 | $69,500 |
| 2019 | $2,538 | $85,450 | $15,950 | $69,500 |
| 2018 | $2,512 | $85,450 | $15,950 | $69,500 |
| 2017 | $1,936 | $59,800 | $12,150 | $47,650 |
| 2016 | $1,619 | $56,450 | $11,050 | $45,400 |
| 2015 | $1,512 | $54,850 | $10,750 | $44,100 |
| 2014 | $1,447 | $49,850 | $9,750 | $40,100 |
| 2013 | $1,465 | $47,500 | $9,300 | $38,200 |
Source: Public Records
Map
Nearby Homes
Your Personal Tour Guide
Ask me questions while you tour the home.