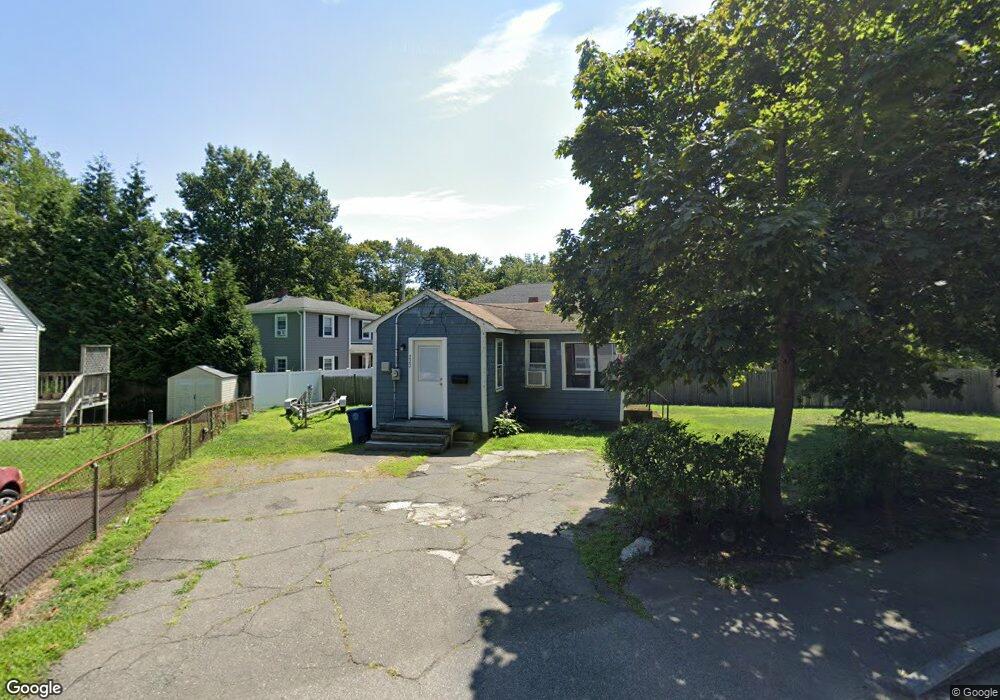
222 Allen St Braintree, MA 02184
East Braintree NeighborhoodEstimated Value: $392,000 - $645,000
1
Bed
1
Bath
418
Sq Ft
$1,101/Sq Ft
Est. Value
About This Home
This home is located at 222 Allen St, Braintree, MA 02184 and is currently estimated at $460,310, approximately $1,101 per square foot. 222 Allen St is a home located in Norfolk County with nearby schools including Braintree High School, Sacred Heart Elementary School, and South Shore Christian Academy.
Ownership History
Date
Name
Owned For
Owner Type
Purchase Details
Closed on
Oct 29, 2010
Sold by
Darmand Joseph E
Bought by
Alabachian Gregory S
Current Estimated Value
Home Financials for this Owner
Home Financials are based on the most recent Mortgage that was taken out on this home.
Original Mortgage
$150,000
Outstanding Balance
$99,571
Interest Rate
4.39%
Mortgage Type
Purchase Money Mortgage
Estimated Equity
$360,739
Create a Home Valuation Report for This Property
The Home Valuation Report is an in-depth analysis detailing your home's value as well as a comparison with similar homes in the area
Home Values in the Area
Average Home Value in this Area
Purchase History
| Date | Buyer | Sale Price | Title Company |
|---|---|---|---|
| Alabachian Gregory S | $150,000 | -- |
Source: Public Records
Mortgage History
| Date | Status | Borrower | Loan Amount |
|---|---|---|---|
| Open | Alabachian Gregory S | $150,000 |
Source: Public Records
Tax History
| Year | Tax Paid | Tax Assessment Tax Assessment Total Assessment is a certain percentage of the fair market value that is determined by local assessors to be the total taxable value of land and additions on the property. | Land | Improvement |
|---|---|---|---|---|
| 2025 | $2,948 | $295,400 | $252,600 | $42,800 |
| 2024 | $2,668 | $281,400 | $239,700 | $41,700 |
| 2023 | $2,487 | $254,800 | $214,100 | $40,700 |
| 2022 | $2,450 | $246,200 | $205,500 | $40,700 |
| 2021 | $2,152 | $216,300 | $179,800 | $36,500 |
| 2020 | $2,123 | $215,300 | $179,800 | $35,500 |
| 2019 | $2,033 | $201,500 | $171,200 | $30,300 |
| 2018 | $1,935 | $183,600 | $154,100 | $29,500 |
| 2017 | $1,788 | $166,500 | $137,000 | $29,500 |
| 2016 | $1,722 | $156,800 | $128,400 | $28,400 |
| 2015 | $1,670 | $150,900 | $123,300 | $27,600 |
| 2014 | $1,583 | $138,600 | $111,300 | $27,300 |
Source: Public Records
Map
Nearby Homes
- 300 Commercial St Unit 23
- 26 Tingley Rd
- 41 Lantern Ln
- 37 Lantern Ln
- 54 Edgemont Rd
- 312 Shaw St
- 16 Beechwood Rd
- 255 River St
- 122 Washington St Unit Twenty-two
- 15 Summer St
- 11 Richmond St
- 25 Richmond St
- 30 Skyline Dr Unit 6
- 36 Chestnut Ave
- 50 Cleveland Ave
- 37 Skyline Dr Unit 11
- 342 Elm St
- 31 Doris Rd
- 20 Vine St
- 19 Vine St Unit 3
- 253 Commercial St Unit 255
- 253 Commercial St Unit 1
- 255 Commercial St Unit 255
- 216 Allen St
- 247 Commercial St
- 208-210 Allen St
- 208 Allen St Unit 210
- 208 Allen St Unit 1
- 241 Commercial St
- 206 Allen St
- 206 Allen St Unit 2
- 1 Taber Ct
- 273 Commercial St
- 202 Allen St
- 202 Allen St Unit 1
- 110 Front St
- 234 Commercial St
- 6 Bowditch St
- 196 Allen St
- 196 Allen St Unit 196
Your Personal Tour Guide
Ask me questions while you tour the home.