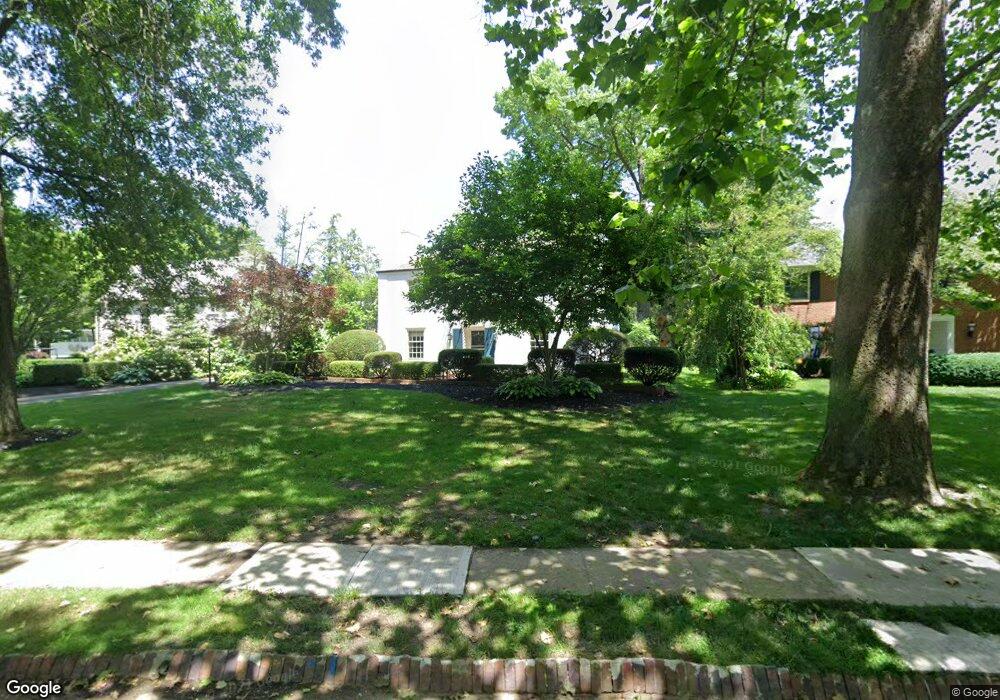
222 Ashbourne Rd Columbus, OH 43209
Estimated Value: $1,341,304 - $1,467,000
5
Beds
6
Baths
3,933
Sq Ft
$354/Sq Ft
Est. Value
About This Home
This home is located at 222 Ashbourne Rd, Columbus, OH 43209 and is currently estimated at $1,392,101, approximately $353 per square foot. 222 Ashbourne Rd is a home located in Franklin County with nearby schools including Maryland Elementary School, Bexley Middle School, and Bexley High School.
Ownership History
Date
Name
Owned For
Owner Type
Purchase Details
Closed on
Dec 27, 2010
Sold by
Sutton Margaret K
Bought by
Sutton Jeffrey S and Sutton Margaret K
Current Estimated Value
Home Financials for this Owner
Home Financials are based on the most recent Mortgage that was taken out on this home.
Original Mortgage
$245,000
Interest Rate
4.4%
Mortgage Type
FHA
Purchase Details
Closed on
Jul 10, 2002
Sold by
Hood Alice K
Bought by
Sutton Margaret K
Home Financials for this Owner
Home Financials are based on the most recent Mortgage that was taken out on this home.
Original Mortgage
$518,500
Outstanding Balance
$212,931
Interest Rate
6.82%
Estimated Equity
$1,179,170
Purchase Details
Closed on
Apr 25, 1984
Bought by
Hood Alice K
Create a Home Valuation Report for This Property
The Home Valuation Report is an in-depth analysis detailing your home's value as well as a comparison with similar homes in the area
Home Values in the Area
Average Home Value in this Area
Purchase History
| Date | Buyer | Sale Price | Title Company |
|---|---|---|---|
| Sutton Jeffrey S | -- | Hummel Titl | |
| Sutton Margaret K | $610,000 | Hummel Title Agency Inc | |
| Hood Alice K | $225,000 | -- |
Source: Public Records
Mortgage History
| Date | Status | Borrower | Loan Amount |
|---|---|---|---|
| Closed | Sutton Jeffrey S | $245,000 | |
| Open | Sutton Margaret K | $518,500 |
Source: Public Records
Tax History
| Year | Tax Paid | Tax Assessment Tax Assessment Total Assessment is a certain percentage of the fair market value that is determined by local assessors to be the total taxable value of land and additions on the property. | Land | Improvement |
|---|---|---|---|---|
| 2025 | $20,127 | $362,430 | $131,250 | $231,180 |
| 2024 | $20,127 | $362,430 | $131,250 | $231,180 |
| 2023 | $18,096 | $362,425 | $131,250 | $231,175 |
| 2022 | $22,137 | $356,090 | $76,860 | $279,230 |
| 2021 | $22,155 | $356,090 | $76,860 | $279,230 |
| 2020 | $21,960 | $356,090 | $76,860 | $279,230 |
| 2019 | $20,480 | $292,180 | $64,050 | $228,130 |
| 2018 | $16,922 | $292,180 | $64,050 | $228,130 |
| 2017 | $16,684 | $292,180 | $64,050 | $228,130 |
| 2016 | $16,002 | $246,020 | $60,410 | $185,610 |
| 2015 | $16,049 | $246,020 | $60,410 | $185,610 |
| 2014 | $16,141 | $246,020 | $60,410 | $185,610 |
| 2013 | $7,627 | $223,650 | $54,915 | $168,735 |
Source: Public Records
Map
Nearby Homes
- 103 N Ardmore Rd
- 343 N Cassady Ave
- 2465 E Broad St
- 2779 Columbus Ave
- 484 N Parkview Ave
- 2822 Bellwood Ave
- 161 N Gould Rd
- 205 N Gould Rd
- 125 S Stanwood Rd
- 696 Northview Ave
- 142 S Gould Rd
- 2599 E 5th Ave
- 271 S Cassingham Rd
- 649 N Nelson Rd Unit A-D
- 50 S Chesterfield Rd
- 57 Preston Rd
- 180 N Harding Rd
- 2430 Plymouth Ave
- 291 Sherborne Dr
- 1994 Stratford Way
- 212 Ashbourne Rd
- 230 Ashbourne Rd
- 222 Ashbourne Place
- 200 Ashbourne Rd
- 240 Ashbourne Place
- 221 Ashbourne Rd
- 246 Ashbourne Place
- 241 Ashbourne Rd
- 214 N Cassady Ave
- 208 N Cassady Ave
- 220 N Cassady Ave
- 202 N Cassady Ave
- 228 N Cassady Ave
- 194 N Cassady Ave
- 180 Ashbourne Rd
- 232 N Cassady Ave
- 188 N Cassady Ave
- 0 Stanbery Ave
- 254 Ashbourne Place
- 244 Stanbery Ave
Your Personal Tour Guide
Ask me questions while you tour the home.