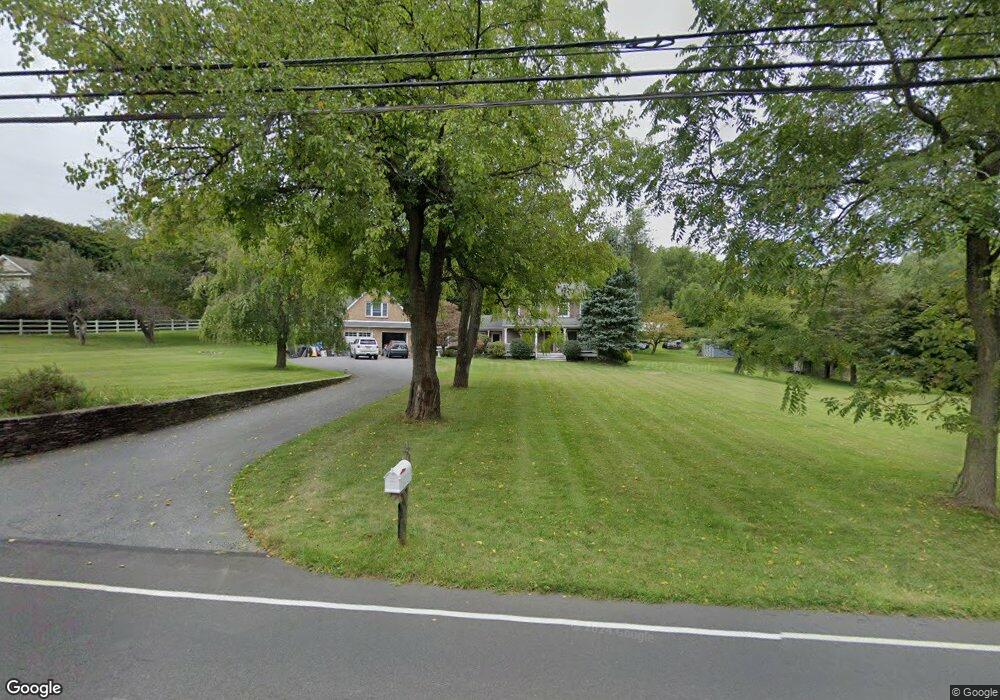
222 Belvidere Ave Oxford, NJ 07863
Estimated Value: $479,031 - $592,000
--
Bed
--
Bath
3,474
Sq Ft
$157/Sq Ft
Est. Value
About This Home
This home is located at 222 Belvidere Ave, Oxford, NJ 07863 and is currently estimated at $547,010, approximately $157 per square foot. 222 Belvidere Ave is a home located in Warren County with nearby schools including Oxford Central School.
Ownership History
Date
Name
Owned For
Owner Type
Purchase Details
Closed on
May 22, 2013
Sold by
Accetturo Nicol Angelo and Accetturo Angelo
Bought by
Accetturo Nicol Angelo and Accetturo Carrie M
Current Estimated Value
Home Financials for this Owner
Home Financials are based on the most recent Mortgage that was taken out on this home.
Original Mortgage
$250,000
Outstanding Balance
$176,754
Interest Rate
3.43%
Mortgage Type
New Conventional
Estimated Equity
$370,256
Purchase Details
Closed on
Mar 18, 2003
Sold by
Accetturo Angelo
Bought by
Accetturo Angelo
Purchase Details
Closed on
Oct 3, 1996
Sold by
Shubelky Frank and Alexander Esq Arthur
Bought by
Acceturro Nicol Angelo
Home Financials for this Owner
Home Financials are based on the most recent Mortgage that was taken out on this home.
Original Mortgage
$55,000
Interest Rate
7.5%
Purchase Details
Closed on
Sep 8, 1995
Sold by
Kelley Don R
Bought by
Shubelky Frank and Alexander Esq Arthur
Create a Home Valuation Report for This Property
The Home Valuation Report is an in-depth analysis detailing your home's value as well as a comparison with similar homes in the area
Home Values in the Area
Average Home Value in this Area
Purchase History
| Date | Buyer | Sale Price | Title Company |
|---|---|---|---|
| Accetturo Nicol Angelo | -- | Old Republic National Title | |
| Accetturo Angelo | -- | -- | |
| Acceturro Nicol Angelo | $60,000 | -- | |
| Shubelky Frank | -- | -- |
Source: Public Records
Mortgage History
| Date | Status | Borrower | Loan Amount |
|---|---|---|---|
| Open | Accetturo Nicol Angelo | $250,000 | |
| Closed | Acceturro Nicol Angelo | $55,000 | |
| Closed | Shubelky Frank | -- |
Source: Public Records
Tax History Compared to Growth
Tax History
| Year | Tax Paid | Tax Assessment Tax Assessment Total Assessment is a certain percentage of the fair market value that is determined by local assessors to be the total taxable value of land and additions on the property. | Land | Improvement |
|---|---|---|---|---|
| 2025 | $13,722 | $283,100 | $63,000 | $220,100 |
| 2024 | $12,635 | $283,100 | $63,000 | $220,100 |
| 2023 | $12,420 | $283,100 | $63,000 | $220,100 |
| 2022 | $12,420 | $283,100 | $63,000 | $220,100 |
| 2021 | $12,074 | $283,100 | $63,000 | $220,100 |
| 2020 | $11,811 | $283,100 | $63,000 | $220,100 |
| 2019 | $11,369 | $283,100 | $63,000 | $220,100 |
| 2018 | $11,369 | $283,100 | $63,000 | $220,100 |
| 2017 | $11,117 | $283,100 | $63,000 | $220,100 |
| 2016 | $11,182 | $283,100 | $63,000 | $220,100 |
| 2015 | $10,824 | $348,600 | $111,400 | $237,200 |
| 2014 | $10,148 | $348,600 | $111,400 | $237,200 |
Source: Public Records
Map
Nearby Homes