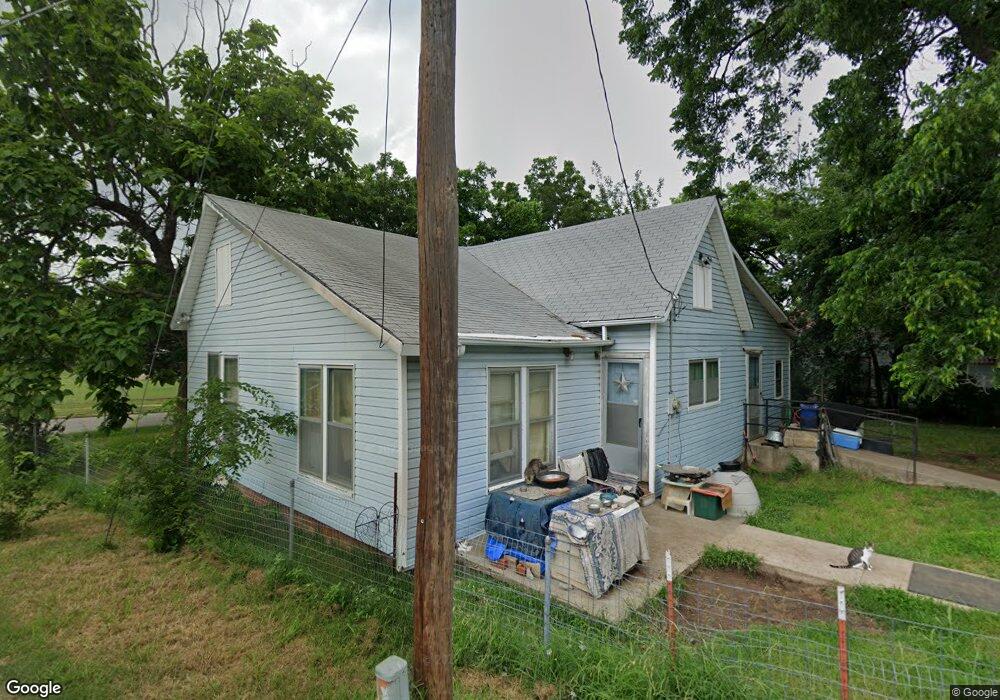
222 C St SE Ardmore, OK 73401
Estimated Value: $55,000 - $97,000
3
Beds
1
Bath
1,137
Sq Ft
$68/Sq Ft
Est. Value
About This Home
This home is located at 222 C St SE, Ardmore, OK 73401 and is currently estimated at $77,669, approximately $68 per square foot. 222 C St SE is a home located in Carter County with nearby schools including Jefferson Elementary School, Ardmore Middle School, and Ardmore High School.
Ownership History
Date
Name
Owned For
Owner Type
Purchase Details
Closed on
Apr 19, 2024
Sold by
Nelson Veronica M and Nelson Chris D
Bought by
Ortiz Jacob
Current Estimated Value
Purchase Details
Closed on
Nov 3, 2006
Sold by
Nunn Carol and Nunn Luke
Bought by
Nelson Chris D and Cryer Veronica M
Home Financials for this Owner
Home Financials are based on the most recent Mortgage that was taken out on this home.
Original Mortgage
$26,500
Interest Rate
6.37%
Mortgage Type
New Conventional
Create a Home Valuation Report for This Property
The Home Valuation Report is an in-depth analysis detailing your home's value as well as a comparison with similar homes in the area
Home Values in the Area
Average Home Value in this Area
Purchase History
| Date | Buyer | Sale Price | Title Company |
|---|---|---|---|
| Ortiz Jacob | $25,000 | Texoma Title | |
| Nelson Chris D | $28,000 | -- |
Source: Public Records
Mortgage History
| Date | Status | Borrower | Loan Amount |
|---|---|---|---|
| Previous Owner | Nelson Chris D | $26,500 |
Source: Public Records
Tax History Compared to Growth
Tax History
| Year | Tax Paid | Tax Assessment Tax Assessment Total Assessment is a certain percentage of the fair market value that is determined by local assessors to be the total taxable value of land and additions on the property. | Land | Improvement |
|---|---|---|---|---|
| 2024 | $643 | $4,232 | $606 | $3,626 |
| 2023 | $422 | $4,030 | $585 | $3,445 |
| 2022 | $367 | $3,839 | $561 | $3,278 |
| 2021 | $369 | $3,656 | $525 | $3,131 |
| 2020 | $346 | $3,482 | $480 | $3,002 |
| 2019 | $338 | $3,482 | $480 | $3,002 |
| 2018 | $344 | $3,486 | $480 | $3,006 |
| 2017 | $332 | $3,634 | $480 | $3,154 |
| 2016 | $362 | $3,879 | $454 | $3,425 |
| 2015 | $284 | $3,694 | $246 | $3,448 |
| 2014 | $315 | $3,518 | $246 | $3,272 |
Source: Public Records
Map
Nearby Homes