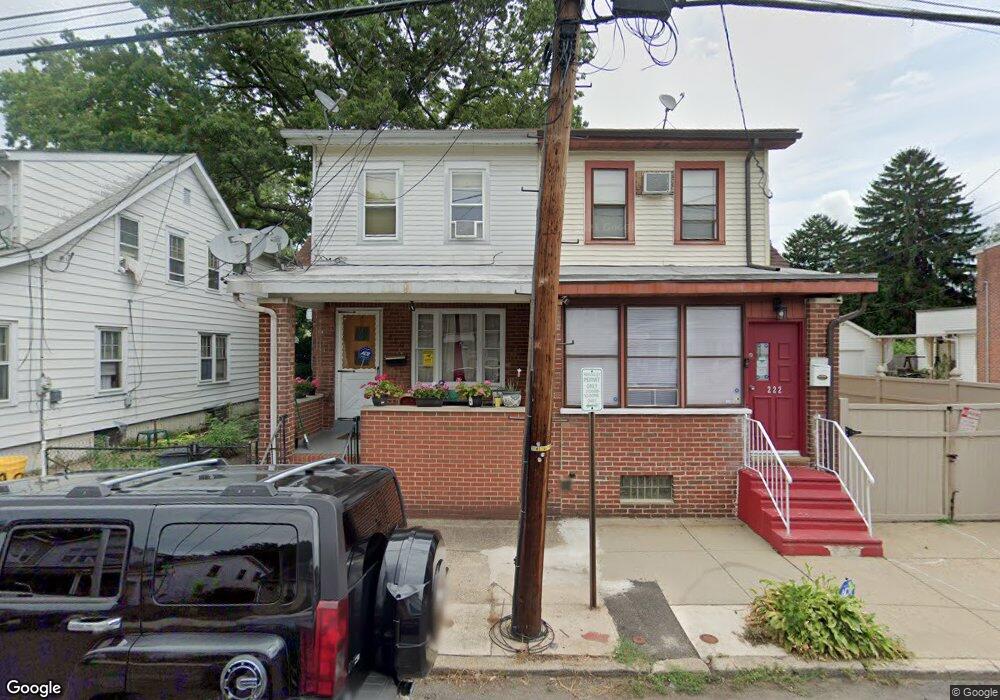
222 Columbus Ave Trenton, NJ 08629
Villa Park NeighborhoodEstimated Value: $200,000 - $284,000
3
Beds
2
Baths
1,278
Sq Ft
$196/Sq Ft
Est. Value
About This Home
This home is located at 222 Columbus Ave, Trenton, NJ 08629 and is currently estimated at $250,021, approximately $195 per square foot. 222 Columbus Ave is a home located in Mercer County with nearby schools including Hedgepeth-Williams Elementary School, Trenton Central High School - Main Campus, and Pace Charter School Of Hamilton.
Ownership History
Date
Name
Owned For
Owner Type
Purchase Details
Closed on
Oct 14, 2008
Sold by
Akber Ali and Afshan Saher
Bought by
Robinson Chikia
Current Estimated Value
Home Financials for this Owner
Home Financials are based on the most recent Mortgage that was taken out on this home.
Original Mortgage
$5,432
Interest Rate
5.83%
Mortgage Type
Unknown
Purchase Details
Closed on
Nov 18, 2005
Sold by
Anwar Mian
Bought by
Akber Ali
Home Financials for this Owner
Home Financials are based on the most recent Mortgage that was taken out on this home.
Original Mortgage
$138,000
Interest Rate
6.28%
Purchase Details
Closed on
Sep 15, 2004
Sold by
Harris Joel
Bought by
Mien Anwar
Home Financials for this Owner
Home Financials are based on the most recent Mortgage that was taken out on this home.
Original Mortgage
$121,400
Interest Rate
6.02%
Create a Home Valuation Report for This Property
The Home Valuation Report is an in-depth analysis detailing your home's value as well as a comparison with similar homes in the area
Home Values in the Area
Average Home Value in this Area
Purchase History
| Date | Buyer | Sale Price | Title Company |
|---|---|---|---|
| Robinson Chikia | $140,000 | -- | |
| Robinson Chikia | $140,000 | Secure Title New Jersey | |
| Akber Ali | $175,000 | -- | |
| Mien Anwar | $134,900 | -- |
Source: Public Records
Mortgage History
| Date | Status | Borrower | Loan Amount |
|---|---|---|---|
| Closed | Robinson Chikia | $5,432 | |
| Open | Robinson Chikia | $138,176 | |
| Closed | Robinson Chikia | $138,176 | |
| Previous Owner | Akber Ali | $138,000 | |
| Previous Owner | Mien Anwar | $121,400 |
Source: Public Records
Tax History Compared to Growth
Tax History
| Year | Tax Paid | Tax Assessment Tax Assessment Total Assessment is a certain percentage of the fair market value that is determined by local assessors to be the total taxable value of land and additions on the property. | Land | Improvement |
|---|---|---|---|---|
| 2025 | $4,142 | $71,400 | $22,000 | $49,400 |
| 2024 | $3,975 | $71,400 | $22,000 | $49,400 |
| 2023 | $3,975 | $71,400 | $22,000 | $49,400 |
| 2022 | $3,897 | $71,400 | $22,000 | $49,400 |
| 2021 | $3,965 | $71,400 | $22,000 | $49,400 |
| 2020 | $3,952 | $71,400 | $22,000 | $49,400 |
| 2019 | $3,888 | $71,400 | $22,000 | $49,400 |
| 2018 | $3,722 | $71,400 | $22,000 | $49,400 |
| 2017 | $3,538 | $71,400 | $22,000 | $49,400 |
| 2016 | $4,493 | $78,100 | $18,500 | $59,600 |
| 2015 | $4,477 | $78,100 | $18,500 | $59,600 |
| 2014 | $4,456 | $78,100 | $18,500 | $59,600 |
Source: Public Records
Map
Nearby Homes
- 131 Columbus Ave
- 112 Columbus Ave
- 104 Columbus Ave
- 872 Revere Ave
- 913 Revere Ave
- 322 Columbus Ave
- 307 Commonwealth Ave
- 907 Quinton Ave
- 809 Quinton Ave
- 837 Hamilton Ave
- 414 Commonwealth Ave
- 225 Franklin St
- 822 Fairmount Ave
- 130 Anderson St
- 877 Park Ave
- 156 Kent St
- 1040 Melrose Ave
- 1031 Fairmount Ave
- 127 Kent St
- 503 Tyler St
- 220 Columbus Ave
- 232 Columbus Ave
- 218 Columbus Ave
- 216 Columbus Ave
- 234 Columbus Ave
- 214 Columbus Ave
- 871 Revere Ave
- 236 Columbus Ave
- 869 Revere Ave
- 881 Revere Ave
- 212 Columbus Ave
- 865 Revere Ave
- 883 Revere Ave
- 863 Revere Ave
- 240 Columbus Ave
- 225 Columbus Ave
- 861 Revere Ave
- 219 Columbus Ave
- 229 Columbus Ave
- 215 Columbus Ave