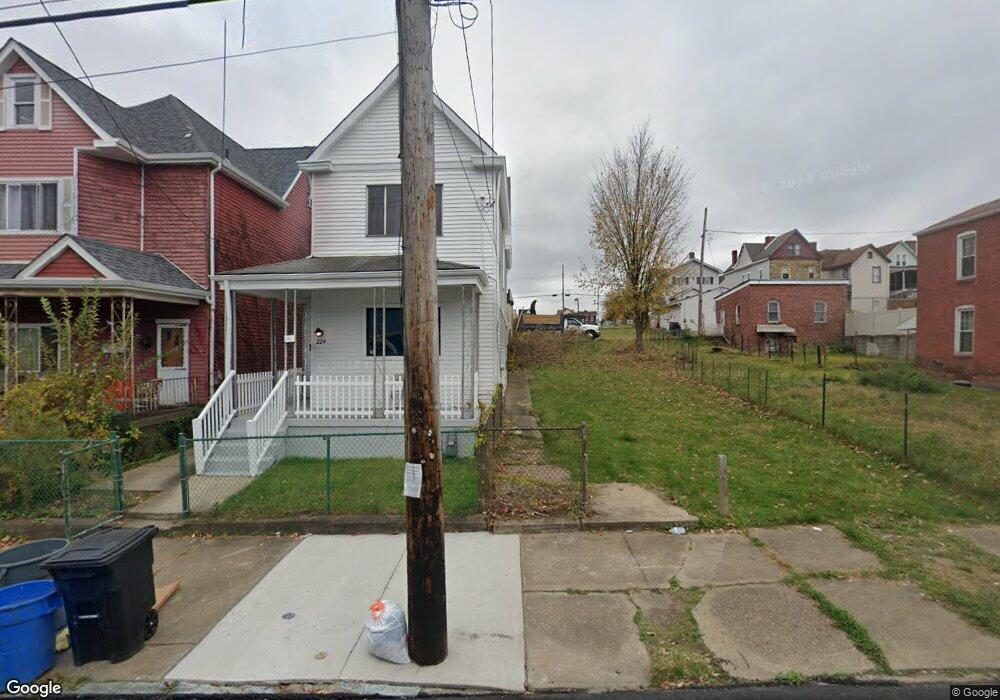
222 Corey Ave Braddock, PA 15104
Estimated Value: $120,000
5
Beds
2
Baths
1,943
Sq Ft
$62/Sq Ft
Est. Value
About This Home
This home is located at 222 Corey Ave, Braddock, PA 15104 and is currently estimated at $120,000, approximately $61 per square foot. 222 Corey Ave is a home located in Allegheny County with nearby schools including Woodland Hills Senior High School, The Western Pennsylvania School for the Deaf, and Braddock Hills High School.
Ownership History
Date
Name
Owned For
Owner Type
Purchase Details
Closed on
Sep 12, 2025
Sold by
J T G Real Estate L L C and Jtg Real Estate L L C
Bought by
Arrington Rentals L L C
Current Estimated Value
Purchase Details
Closed on
Aug 8, 2020
Sold by
Brooks David H and Brooks Tiffany
Bought by
J T G Real Estate L L C
Purchase Details
Closed on
Apr 19, 2019
Sold by
Brooks Jennifer A and Brooks David H
Bought by
Brooks David H
Purchase Details
Closed on
Dec 19, 2007
Sold by
Stamerva Philomena
Bought by
Brooks David H
Home Financials for this Owner
Home Financials are based on the most recent Mortgage that was taken out on this home.
Original Mortgage
$26,100
Interest Rate
6.17%
Mortgage Type
New Conventional
Create a Home Valuation Report for This Property
The Home Valuation Report is an in-depth analysis detailing your home's value as well as a comparison with similar homes in the area
Home Values in the Area
Average Home Value in this Area
Purchase History
| Date | Buyer | Sale Price | Title Company |
|---|---|---|---|
| Arrington Rentals L L C | $2,000 | -- | |
| J T G Real Estate L L C | $2,000 | None Available | |
| Brooks David H | -- | None Available | |
| Brooks David H | $29,000 | -- |
Source: Public Records
Mortgage History
| Date | Status | Borrower | Loan Amount |
|---|---|---|---|
| Previous Owner | Brooks David H | $26,100 |
Source: Public Records
Tax History
| Year | Tax Paid | Tax Assessment Tax Assessment Total Assessment is a certain percentage of the fair market value that is determined by local assessors to be the total taxable value of land and additions on the property. | Land | Improvement |
|---|---|---|---|---|
| 2025 | $139 | $3,100 | $3,100 | -- |
| 2024 | $139 | $3,100 | $3,100 | -- |
| 2023 | $141 | $3,100 | $3,100 | $0 |
| 2022 | $141 | $3,100 | $3,100 | $0 |
| 2021 | $15 | $3,100 | $3,100 | $0 |
| 2020 | $1,192 | $3,100 | $3,100 | $0 |
| 2019 | $1,172 | $26,800 | $3,100 | $23,700 |
| 2017 | $1,145 | $26,800 | $3,100 | $23,700 |
Source: Public Records
Map
Nearby Homes
Your Personal Tour Guide
Ask me questions while you tour the home.