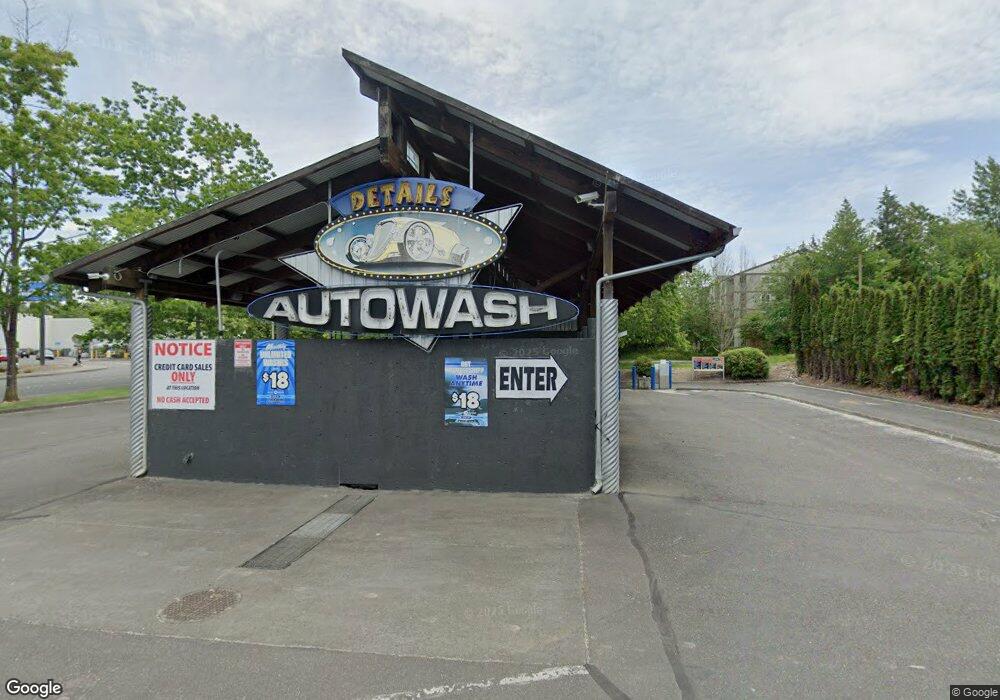
222 E Stuart Rd Bellingham, WA 98226
Meridian Neighborhood
--
Bed
--
Bath
2,352
Sq Ft
0.43
Acres
About This Home
This home is located at 222 E Stuart Rd, Bellingham, WA 98226. 222 E Stuart Rd is a home located in Whatcom County with nearby schools including Cordata Elementary School, Shuksan Middle School, and Squalicum High School.
Ownership History
Date
Name
Owned For
Owner Type
Purchase Details
Closed on
Mar 23, 2017
Sold by
Flying Dutchman Enterprises Llc
Bought by
Wig Wash Llc
Home Financials for this Owner
Home Financials are based on the most recent Mortgage that was taken out on this home.
Original Mortgage
$280,000
Outstanding Balance
$232,062
Interest Rate
4.15%
Mortgage Type
Seller Take Back
Purchase Details
Closed on
Apr 8, 2011
Sold by
Bidman Calleen
Bought by
Flying Dutchman Enterprises L L C
Home Financials for this Owner
Home Financials are based on the most recent Mortgage that was taken out on this home.
Original Mortgage
$18,325
Interest Rate
4.9%
Mortgage Type
Commercial
Purchase Details
Closed on
Jul 13, 2005
Sold by
Montres Corp
Bought by
Wilson Investments Llc
Home Financials for this Owner
Home Financials are based on the most recent Mortgage that was taken out on this home.
Original Mortgage
$660,400
Interest Rate
5.55%
Mortgage Type
Commercial
Create a Home Valuation Report for This Property
The Home Valuation Report is an in-depth analysis detailing your home's value as well as a comparison with similar homes in the area
Home Values in the Area
Average Home Value in this Area
Purchase History
| Date | Buyer | Sale Price | Title Company |
|---|---|---|---|
| Wig Wash Llc | $2,800,000 | Chicago Title Insurance | |
| Flying Dutchman Enterprises L L C | $625,280 | Whatcom Land Title | |
| Flying Dutchman Enterprises L L C | $625,280 | Whatcom Land Title | |
| Bidman Calleen | -- | Whatcom Land Title | |
| Bct Properties L L C | -- | Whatcom Land Title | |
| Wilson Investments Llc | $850,280 | First American Title Insuran |
Source: Public Records
Mortgage History
| Date | Status | Borrower | Loan Amount |
|---|---|---|---|
| Open | Wig Wash Llc | $280,000 | |
| Previous Owner | Flying Dutchman Enterprises L L C | $18,325 | |
| Previous Owner | Flying Dutchman Enterprises L L C | $1,710,000 | |
| Previous Owner | Wilson Investments Llc | $660,400 |
Source: Public Records
Tax History Compared to Growth
Tax History
| Year | Tax Paid | Tax Assessment Tax Assessment Total Assessment is a certain percentage of the fair market value that is determined by local assessors to be the total taxable value of land and additions on the property. | Land | Improvement |
|---|---|---|---|---|
| 2024 | $6,887 | $885,105 | $547,142 | $337,963 |
| 2023 | $6,887 | $885,105 | $547,142 | $337,963 |
| 2022 | $7,232 | $903,168 | $558,308 | $344,860 |
| 2021 | $6,927 | $778,593 | $481,300 | $297,293 |
| 2020 | $7,166 | $703,803 | $455,383 | $248,420 |
| 2019 | $6,332 | $703,803 | $455,383 | $248,420 |
| 2018 | $6,934 | $623,467 | $403,403 | $220,064 |
| 2017 | $6,087 | $583,780 | $377,724 | $206,056 |
| 2016 | $5,847 | $535,578 | $346,536 | $189,042 |
| 2015 | $5,666 | $535,578 | $346,536 | $189,042 |
| 2014 | -- | $502,159 | $339,605 | $162,554 |
| 2013 | -- | $502,159 | $339,605 | $162,554 |
Source: Public Records
Map
Nearby Homes
- 200 E Stuart Rd
- 4492 Meridian St
- 0 van Wyck Rd Unit NWM2286922
- 0 van Wyck Rd Unit NWM2341163
- 4244 Archer Dr
- 4200 Cordata Pkwy
- 4450 Cordata Pkwy
- 4302 Creston Way
- 4300 Creston Way
- 4268 Creston Way
- 4260 Creston Way
- 571 Creston Ct
- 570 Creston Way
- 4148 Deemer Rd Unit 202
- 578 Creston Way
- 0 Cordata Pkwy Unit NWM2311834
- 246 Prince Ave Unit 202
- 290 Prince Ave
- 5064 Festival Blvd Unit 2B
- 4682 Guide Meridian
- 222 Stuart Rd
- 400 E Stuart Rd
- 200 Stuart Rd
- 200 Stuart Rd Unit Lot A
- 145 E Stuart Rd
- 4370 4380 Tull Rd
- 4370 Tull Rd
- 4370 Meridian St
- 4364 Meridian St
- 6883 Guide Meridian Rd
- 4358 Meridian St
- 4346 Guide Meridian
- 4346 Meridian St
- 103 W Stuart Rd
- 4429 Meridian St
- 4456 Meridian St
- 4472 Meridian St
- 201 Tull Ct
- 201 Tull Ct
- 4322 Tull Rd