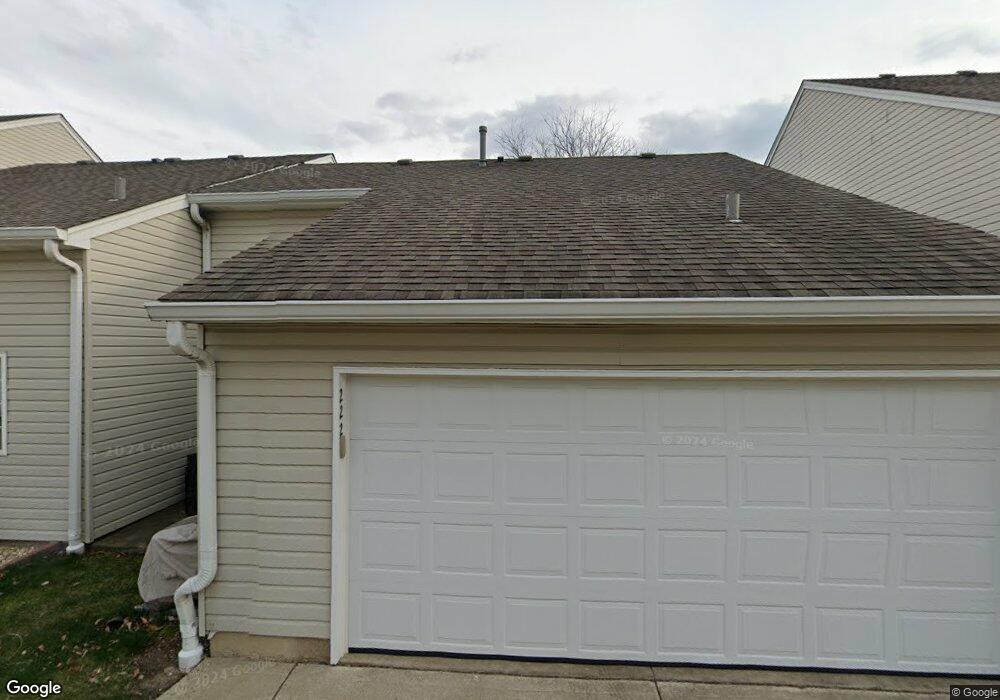
222 E Victoria Cir Unit CIR 2/5 North Aurora, IL 60542
Estimated Value: $253,000 - $267,000
2
Beds
2
Baths
1,210
Sq Ft
$214/Sq Ft
Est. Value
About This Home
This home is located at 222 E Victoria Cir Unit CIR 2/5, North Aurora, IL 60542 and is currently estimated at $259,339, approximately $214 per square foot. 222 E Victoria Cir Unit CIR 2/5 is a home located in Kane County with nearby schools including Goodwin Elementary School, Jewel Middle School, and West Aurora High School.
Ownership History
Date
Name
Owned For
Owner Type
Purchase Details
Closed on
Jun 28, 2022
Sold by
Orduna Alicia A
Bought by
Trevino Juanita
Current Estimated Value
Home Financials for this Owner
Home Financials are based on the most recent Mortgage that was taken out on this home.
Original Mortgage
$209,757
Outstanding Balance
$199,351
Interest Rate
4.97%
Mortgage Type
FHA
Estimated Equity
$59,988
Purchase Details
Closed on
Jan 5, 2019
Sold by
Salesky Gary L and Salesky Robert
Bought by
Orduna Alicia A
Purchase Details
Closed on
Oct 30, 2015
Sold by
Joy Debra A
Bought by
Salesky Donald and Salesky Sarah
Purchase Details
Closed on
Apr 29, 1997
Sold by
Galle Helen M
Bought by
Joy Debra A and Helen M Galle Trust
Purchase Details
Closed on
Sep 19, 1996
Sold by
The Bigelow Group Inc
Bought by
Galle Helen M
Create a Home Valuation Report for This Property
The Home Valuation Report is an in-depth analysis detailing your home's value as well as a comparison with similar homes in the area
Home Values in the Area
Average Home Value in this Area
Purchase History
| Date | Buyer | Sale Price | Title Company |
|---|---|---|---|
| Trevino Juanita | $217,000 | First American Title | |
| Orduna Alicia A | $162,000 | First American Title | |
| Salesky Donald | $115,000 | Chicago Title Insurance Co | |
| Joy Debra A | -- | -- | |
| Galle Helen M | $126,500 | Century Title Co |
Source: Public Records
Mortgage History
| Date | Status | Borrower | Loan Amount |
|---|---|---|---|
| Open | Trevino Juanita | $209,757 |
Source: Public Records
Tax History Compared to Growth
Tax History
| Year | Tax Paid | Tax Assessment Tax Assessment Total Assessment is a certain percentage of the fair market value that is determined by local assessors to be the total taxable value of land and additions on the property. | Land | Improvement |
|---|---|---|---|---|
| 2024 | $4,796 | $71,015 | $7,184 | $63,831 |
| 2023 | $4,571 | $63,452 | $6,419 | $57,033 |
| 2022 | $3,929 | $57,894 | $5,857 | $52,037 |
| 2021 | $3,667 | $53,467 | $5,453 | $48,014 |
| 2020 | $3,402 | $49,663 | $5,065 | $44,598 |
| 2019 | $3,256 | $46,014 | $4,693 | $41,321 |
| 2018 | $3,691 | $44,565 | $4,341 | $40,224 |
| 2017 | $3,510 | $41,648 | $5,166 | $36,482 |
| 2016 | $3,445 | $39,923 | $4,428 | $35,495 |
| 2015 | -- | $34,647 | $3,808 | $30,839 |
| 2014 | -- | $32,800 | $3,140 | $29,660 |
| 2013 | -- | $32,333 | $3,095 | $29,238 |
Source: Public Records
Map
Nearby Homes
- 201 Hidden Creek Ln Unit 301
- 311 Hidden Creek Ln Unit 311
- 203 E Victoria Cir Unit 9/2
- 109 E Victoria Cir Unit 7/5
- 1202 Fox Hill Ln Unit 362
- 316 E Victoria Cir Unit 125
- 420 Hidden Creek Ln Unit 65
- 1403 Prairie Ct
- 71 Windstone Dr
- 413 Messenger Cir
- 1640 Abington Ln
- 1432 Hartsburg Ln Unit 1
- 43 S Juniper Dr Unit 3
- Lot 16 West Orchard Gateway Blvd
- 13 Poplar Place
- 406 Juniper Dr
- 438 Mallard Point Dr
- 442 Mallard Point Dr
- 303 N Sycamore Ln
- Lot 1 North Orchard Gateway Blvd
- 216 E Victoria Cir Unit 2/2
- 222 E Victoria Cir Unit 222
- 214 E Victoria Cir Unit 2/1
- 313 E Victoria Cir Unit 31
- 219 E Victoria Cir Unit 14
- 215 E Victoria Cir Unit CIR 1/2
- 213 E Victoria Cir Unit 11
- 314 E Victoria Cir Unit 4/01
- 216 Hidden Creek Ln Unit 28
- 218 Hidden Creek Ln Unit 27
- 214 Hidden Creek Ln Unit 29
- 313 Hidden Creek Ln Unit 39
- 320 E Victoria Cir Unit 4/4
- 215 Hidden Creek Ln Unit 17
- 217 Hidden Creek Ln Unit 16
- 213 Hidden Creek Ln Unit LN 1/8
- 320 Hidden Creek Ln Unit 46
- 314 Hidden Creek Ln Unit 49
- 318 Hidden Creek Ln Unit 7
- 201 E Victoria Cir Unit 9/1