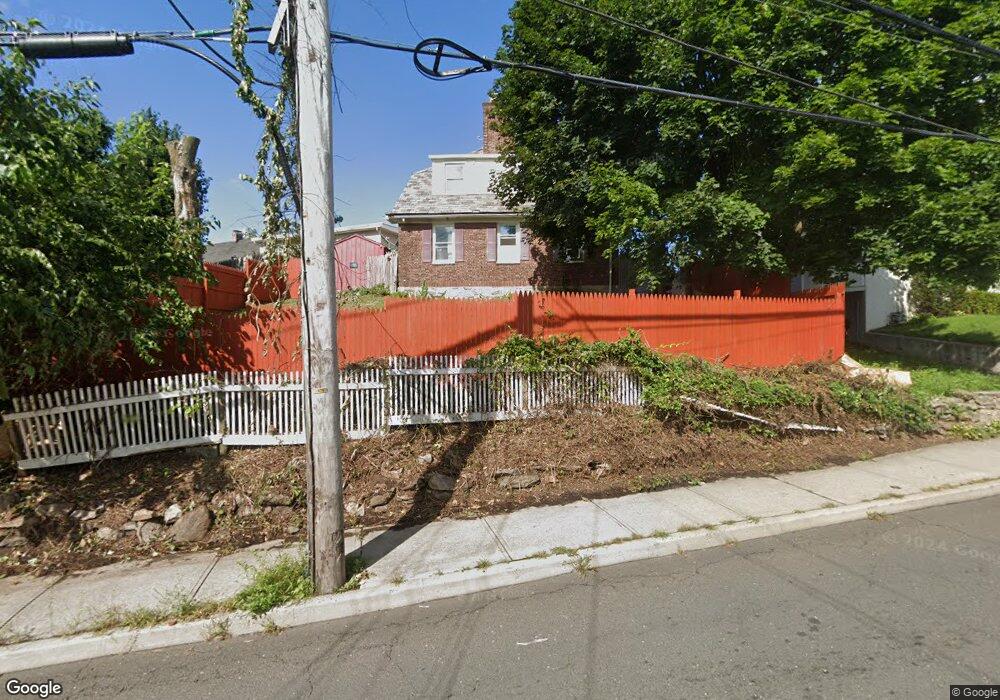
222 Flax Hill Rd Norwalk, CT 06854
Brookside NeighborhoodEstimated Value: $627,000 - $845,422
2
Beds
2
Baths
1,200
Sq Ft
$637/Sq Ft
Est. Value
About This Home
This home is located at 222 Flax Hill Rd, Norwalk, CT 06854 and is currently estimated at $764,606, approximately $637 per square foot. 222 Flax Hill Rd is a home located in Fairfield County with nearby schools including Brookside Elementary School, Roton Middle School, and Brien Mcmahon High School.
Ownership History
Date
Name
Owned For
Owner Type
Purchase Details
Closed on
Apr 12, 2010
Sold by
Deutsche Bank Natl T C
Bought by
Chimblo Ashley
Current Estimated Value
Home Financials for this Owner
Home Financials are based on the most recent Mortgage that was taken out on this home.
Original Mortgage
$100,000
Outstanding Balance
$66,998
Interest Rate
5.12%
Estimated Equity
$697,608
Purchase Details
Closed on
Dec 14, 2009
Sold by
Villegas Edgar Dejesus
Bought by
Deutsche Bank Natl T C
Purchase Details
Closed on
Aug 10, 2006
Sold by
Birdsell Michael J and Birdsell Heather
Bought by
Villegas Edgar Dejesus
Purchase Details
Closed on
Dec 31, 2001
Sold by
Fulton Barbara G and Fulton Michael J
Bought by
Birdsell Michael J and Birdsell Heather
Purchase Details
Closed on
Dec 22, 1998
Sold by
Fnma
Bought by
Fulten Barbara and Birdsell Michael
Create a Home Valuation Report for This Property
The Home Valuation Report is an in-depth analysis detailing your home's value as well as a comparison with similar homes in the area
Home Values in the Area
Average Home Value in this Area
Purchase History
| Date | Buyer | Sale Price | Title Company |
|---|---|---|---|
| Chimblo Ashley | $304,000 | -- | |
| Chimblo Ashley | $304,000 | -- | |
| Deutsche Bank Natl T C | -- | -- | |
| Deutsche Bank Natl T C | -- | -- | |
| Villegas Edgar Dejesus | $540,000 | -- | |
| Villegas Edgar Dejesus | $540,000 | -- | |
| Birdsell Michael J | $161,000 | -- | |
| Birdsell Michael J | $161,000 | -- | |
| Fulten Barbara | $150,000 | -- | |
| Fulten Barbara | $150,000 | -- |
Source: Public Records
Mortgage History
| Date | Status | Borrower | Loan Amount |
|---|---|---|---|
| Open | Fulten Barbara | $100,000 | |
| Closed | Fulten Barbara | $100,000 |
Source: Public Records
Tax History Compared to Growth
Tax History
| Year | Tax Paid | Tax Assessment Tax Assessment Total Assessment is a certain percentage of the fair market value that is determined by local assessors to be the total taxable value of land and additions on the property. | Land | Improvement |
|---|---|---|---|---|
| 2025 | $11,502 | $481,240 | $127,250 | $353,990 |
| 2024 | $11,599 | $492,630 | $127,250 | $365,380 |
| 2023 | $6,906 | $275,280 | $69,984 | $205,296 |
| 2022 | $6,757 | $275,280 | $69,984 | $205,296 |
| 2021 | $8,248 | $344,100 | $87,480 | $256,620 |
| 2020 | $8,243 | $344,100 | $87,480 | $256,620 |
| 2019 | $8,023 | $344,100 | $87,480 | $256,620 |
| 2018 | $6,508 | $244,620 | $78,670 | $165,950 |
| 2017 | $6,282 | $244,620 | $78,670 | $165,950 |
| 2016 | $6,223 | $244,620 | $78,670 | $165,950 |
| 2015 | $5,881 | $231,810 | $78,670 | $153,140 |
| 2014 | $5,805 | $231,810 | $78,670 | $153,140 |
Source: Public Records
Map
Nearby Homes
- 4 Lowe St Unit 201
- 7 Hamilton Ave Unit 32
- 187 Flax Hill Rd Unit D5
- 18 Soundview Ave
- 15 Madison St Unit F9
- 15 Madison St Unit G11
- 25 Chestnut St Unit 1-I
- 47 Taylor Ave
- 28 Chestnut St
- 6 W Couch St
- 59 Taylor Ave
- 17 Woodlawn Ave
- 42 S Main St Unit 202
- 52 Lexington Ave
- 9 Observatory Place Unit A
- 94 Washington St Unit 20
- 8 Crown Ave
- 134 Washington St Unit 206
- 118 Washington St Unit 304
- 10 Ann St Unit 206
- 222 Flax Hill Rd
- 222 Flax Hill Rd Unit A
- 224 Flax Hill Rd
- 1 Lowe St
- 5 Lowe St
- 232 Flax Hill Rd
- 6 Lowe St
- 6 Lowe St
- 10 Lowe St
- 4 Lowe St Unit 404
- 4 Lowe St Unit 403
- 4 Lowe St Unit 402
- 4 Lowe St Unit 303
- 4 Lowe St Unit 302
- 4 Lowe St Unit 301
- 4 Lowe St Unit 204
- 4 Lowe St Unit 203
- 4 Lowe St Unit 202
- 4 Lowe St Unit 104
- 4 Lowe St Unit 103