Estimated Value: $238,000
--
Bed
--
Bath
676
Sq Ft
$352/Sq Ft
Est. Value
About This Home
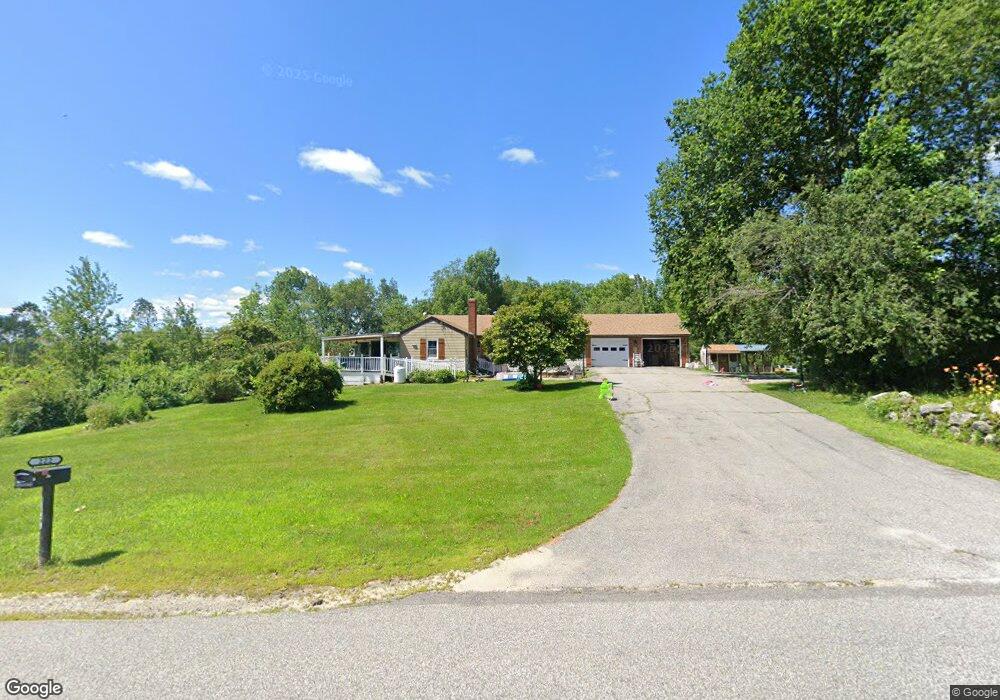
This home is located at 222 Garfield Rd, Minot, ME 04258 and is currently priced at $238,000, approximately $352 per square foot. 222 Garfield Rd is a home located in Androscoggin County with nearby schools including Minot Consolidated School.
Ownership History
Date
Name
Owned For
Owner Type
Purchase Details
Closed on
Jul 20, 2023
Sold by
Nason Ft and Ouellette
Bought by
Nason Neal and Nason Cynthia
Current Estimated Value
Purchase Details
Closed on
Jun 28, 2023
Sold by
Nason Ft and Ouellette
Bought by
Foster Mary E and King Connie
Purchase Details
Closed on
Sep 30, 2022
Sold by
Nason Ft and Ouellette
Bought by
Foster Mary E and Mercier Randall
Home Financials for this Owner
Home Financials are based on the most recent Mortgage that was taken out on this home.
Original Mortgage
$142,450
Interest Rate
5.55%
Mortgage Type
FHA
Purchase Details
Closed on
May 22, 2015
Sold by
Nason John W and Nason Charlene C
Bought by
Nason Ft and Ouellette
Create a Home Valuation Report for This Property
The Home Valuation Report is an in-depth analysis detailing your home's value as well as a comparison with similar homes in the area
Home Values in the Area
Average Home Value in this Area
Purchase History
| Date | Buyer | Sale Price | Title Company |
|---|---|---|---|
| Nason Neal | -- | None Available | |
| Nason Neal E | -- | None Available | |
| Nason Neal | -- | None Available | |
| Foster Mary E | -- | None Available | |
| Gora Donald W | $3,000 | None Available | |
| King Glenn | -- | None Available | |
| Foster Mary E | -- | None Available | |
| Ouellette G R G | -- | None Available | |
| Foster Mary E | -- | None Available | |
| Foster Mary E | -- | None Available | |
| Nason Ft | -- | -- | |
| Nason Ft | -- | -- |
Source: Public Records
Mortgage History
| Date | Status | Borrower | Loan Amount |
|---|---|---|---|
| Previous Owner | Foster Mary E | $142,450 |
Source: Public Records
Tax History Compared to Growth
Tax History
| Year | Tax Paid | Tax Assessment Tax Assessment Total Assessment is a certain percentage of the fair market value that is determined by local assessors to be the total taxable value of land and additions on the property. | Land | Improvement |
|---|---|---|---|---|
| 2023 | $1,281 | $128,060 | $106,815 | $21,245 |
| 2022 | $2,727 | $276,828 | $122,795 | $154,033 |
| 2021 | $2,762 | $166,916 | $80,202 | $86,714 |
| 2020 | $2,795 | $168,862 | $82,148 | $86,714 |
| 2019 | $2,611 | $164,704 | $77,990 | $86,714 |
| 2018 | $2,649 | $167,106 | $80,392 | $86,714 |
| 2017 | $2,598 | $165,479 | $78,765 | $86,714 |
| 2016 | $2,522 | $163,739 | $77,025 | $86,714 |
| 2015 | $2,406 | $154,242 | $67,528 | $86,714 |
| 2014 | $2,321 | $154,735 | $68,021 | $86,714 |
Source: Public Records
Map
Nearby Homes
- 355 Woodman Hill Rd
- 422 Woodman Hill Rd
- Lot 14C Mechanic Falls Rd
- 822 Woodman Hill Rd
- 759 Lake St
- 88 Cove Rd
- 164 Hotel Rd
- 733 Lake St
- 3 Chestnut Dr
- 110 Jackass Annie Rd
- 232 Grange Ave
- 50 Cortland Dr
- 160 Maple Ln
- 521 Stevens Mill Rd
- 36 Colonial Way Unit 36
- 156 Lewiston St
- 65 Cedarwood Rd
- 351 W Auburn Rd
- 10 Hackett Mills Rd
- 444 W Auburn Rd
- 204 Garfield Rd
- 196 Garfield Rd
- 227 Garfield Rd
- 189 Garfield Rd
- 233 Garfield Rd
- 177 Garfield Rd
- 242 Garfield Rd
- 165 Garfield Rd
- 251 Garfield Rd
- 157 Garfield Rd
- 254 Garfield Rd
- 254 Garfield Rd
- 168 Garfield Rd
- 262 Garfield Rd
- 66 Hillside Ave
- 288 Garfield Rd
- 67 Hillside Ave
- 65 Hillside Ave
- 64 Hillside Ave
- 212 Center Minot Hill Rd