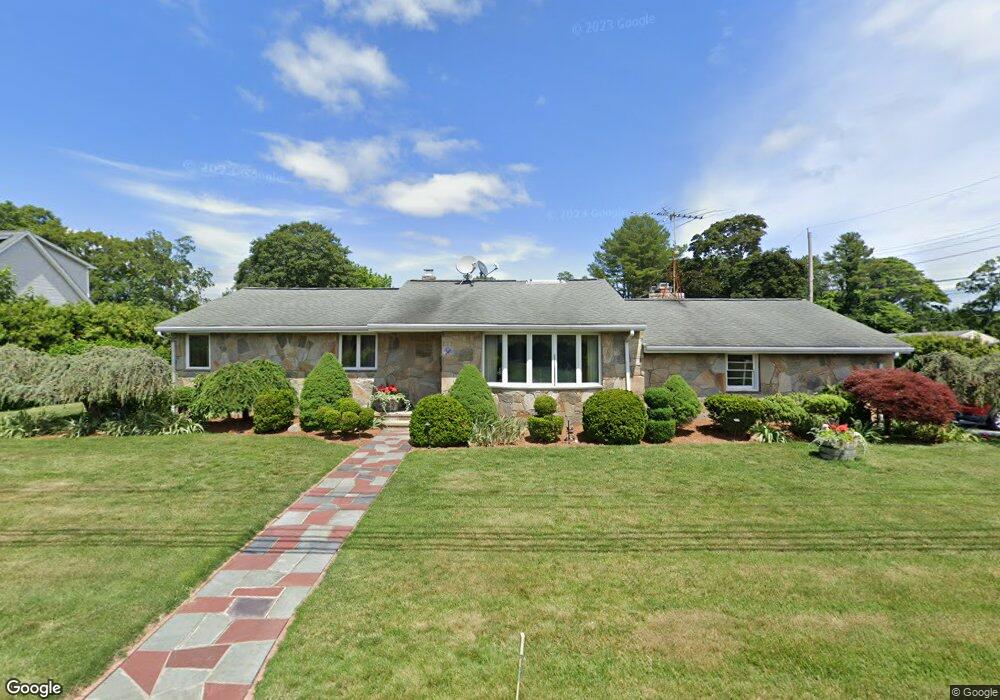
222 Gifford Rd Westport, MA 02790
North Westport NeighborhoodEstimated Value: $431,000 - $559,000
3
Beds
--
Bath
1,438
Sq Ft
$345/Sq Ft
Est. Value
About This Home
This home is located at 222 Gifford Rd, Westport, MA 02790 and is currently estimated at $495,799, approximately $344 per square foot. 222 Gifford Rd is a home located in Bristol County with nearby schools including Alice A. Macomber Primary School, Westport Elementary School, and Westport Middle-High School.
Ownership History
Date
Name
Owned For
Owner Type
Purchase Details
Closed on
Mar 3, 2025
Sold by
Holroyd James P and Holroyd Kelly M
Bought by
222 Gifford Rd Llc
Current Estimated Value
Purchase Details
Closed on
Mar 29, 2019
Sold by
Pavao Norberta M and Pavao James S
Bought by
Holroyd James P and Holroyd Kelly M
Purchase Details
Closed on
Mar 24, 1977
Bought by
Pavao Norberta M
Create a Home Valuation Report for This Property
The Home Valuation Report is an in-depth analysis detailing your home's value as well as a comparison with similar homes in the area
Home Values in the Area
Average Home Value in this Area
Purchase History
| Date | Buyer | Sale Price | Title Company |
|---|---|---|---|
| 222 Gifford Rd Llc | -- | None Available | |
| 222 Gifford Rd Llc | -- | None Available | |
| 222 Gifford Rd Llc | -- | None Available | |
| Holroyd James P | -- | -- | |
| Holroyd James P | -- | -- | |
| Pavao Norberta M | -- | -- |
Source: Public Records
Tax History Compared to Growth
Tax History
| Year | Tax Paid | Tax Assessment Tax Assessment Total Assessment is a certain percentage of the fair market value that is determined by local assessors to be the total taxable value of land and additions on the property. | Land | Improvement |
|---|---|---|---|---|
| 2025 | $3,323 | $446,100 | $164,300 | $281,800 |
| 2024 | $3,276 | $423,800 | $145,900 | $277,900 |
| 2023 | $3,170 | $388,500 | $132,900 | $255,600 |
| 2022 | $2,970 | $350,200 | $132,900 | $217,300 |
| 2021 | $2,820 | $327,100 | $109,800 | $217,300 |
| 2020 | $2,614 | $310,100 | $105,400 | $204,700 |
| 2019 | $2,587 | $312,800 | $105,400 | $207,400 |
| 2018 | $2,444 | $299,100 | $105,300 | $193,800 |
| 2017 | $2,318 | $290,900 | $101,900 | $189,000 |
| 2016 | $2,137 | $270,200 | $98,600 | $171,600 |
| 2015 | $2,014 | $254,000 | $100,800 | $153,200 |
Source: Public Records
Map
Nearby Homes