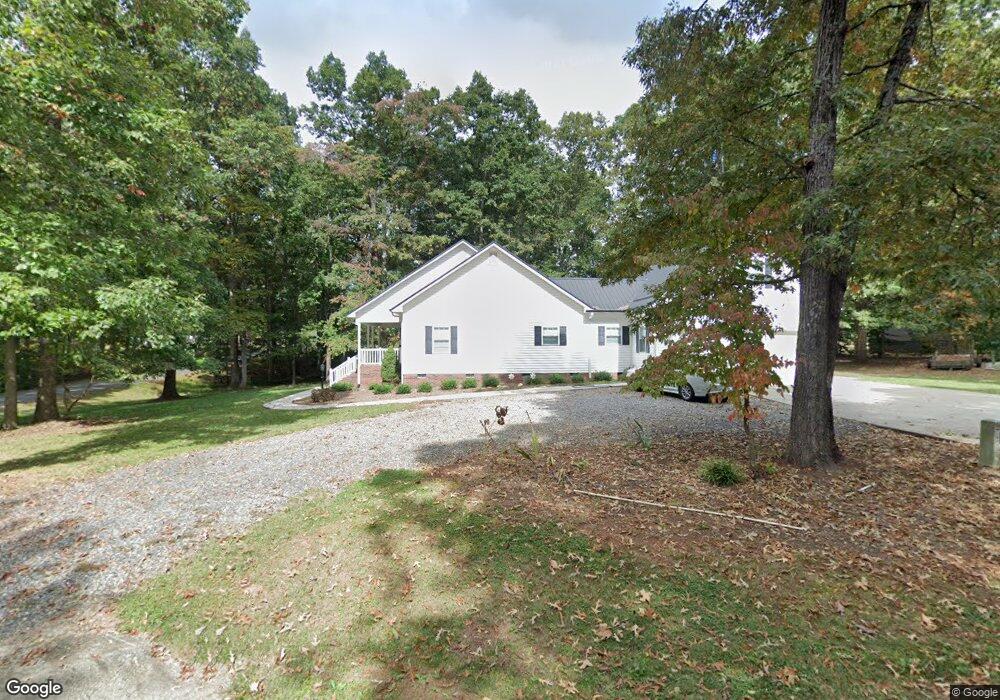
222 Jo Monni Loop Statesville, NC 28625
Estimated Value: $322,000 - $405,000
3
Beds
2
Baths
1,822
Sq Ft
$202/Sq Ft
Est. Value
About This Home
This home is located at 222 Jo Monni Loop, Statesville, NC 28625 and is currently estimated at $368,576, approximately $202 per square foot. 222 Jo Monni Loop is a home located in Iredell County with nearby schools including N.B. Mills Elementary School, West Iredell Middle School, and West Iredell High School.
Ownership History
Date
Name
Owned For
Owner Type
Purchase Details
Closed on
Sep 21, 2020
Sold by
Stikeleather Timothy M
Bought by
Stikeleather Timothy M and Stikeleather Aliza R
Current Estimated Value
Home Financials for this Owner
Home Financials are based on the most recent Mortgage that was taken out on this home.
Original Mortgage
$188,000
Outstanding Balance
$166,838
Interest Rate
2.9%
Mortgage Type
New Conventional
Estimated Equity
$201,738
Purchase Details
Closed on
Aug 18, 2011
Sold by
Stikeleather Donna M
Bought by
Stikeleather Timothny M
Purchase Details
Closed on
Sep 17, 2010
Sold by
Stikeleather Donna M and Stikeleather Timothy M
Bought by
Stikeleather Timothy M and Stikeleather Donna M
Home Financials for this Owner
Home Financials are based on the most recent Mortgage that was taken out on this home.
Original Mortgage
$218,000
Interest Rate
4.45%
Mortgage Type
New Conventional
Create a Home Valuation Report for This Property
The Home Valuation Report is an in-depth analysis detailing your home's value as well as a comparison with similar homes in the area
Home Values in the Area
Average Home Value in this Area
Purchase History
| Date | Buyer | Sale Price | Title Company |
|---|---|---|---|
| Stikeleather Timothy M | -- | None Available | |
| Stikeleather Timothy M | -- | None Listed On Document | |
| Stikeleather Timothny M | -- | None Available | |
| Stikeleather Timothy M | -- | None Available |
Source: Public Records
Mortgage History
| Date | Status | Borrower | Loan Amount |
|---|---|---|---|
| Open | Stikeleather Timothy M | $188,000 | |
| Closed | Stikeleather Timothy M | $188,000 | |
| Previous Owner | Stikeleather Timothy M | $218,000 |
Source: Public Records
Tax History Compared to Growth
Tax History
| Year | Tax Paid | Tax Assessment Tax Assessment Total Assessment is a certain percentage of the fair market value that is determined by local assessors to be the total taxable value of land and additions on the property. | Land | Improvement |
|---|---|---|---|---|
| 2024 | $1,786 | $292,520 | $33,150 | $259,370 |
| 2023 | $1,786 | $292,520 | $33,150 | $259,370 |
| 2022 | $1,361 | $207,250 | $21,450 | $185,800 |
| 2021 | $1,357 | $207,250 | $21,450 | $185,800 |
| 2020 | $1,356 | $207,250 | $21,450 | $185,800 |
| 2019 | $1,336 | $207,250 | $21,450 | $185,800 |
| 2018 | $1,203 | $192,670 | $21,450 | $171,220 |
| 2017 | $1,203 | $192,670 | $21,450 | $171,220 |
| 2016 | $1,203 | $192,670 | $21,450 | $171,220 |
| 2015 | $1,203 | $192,670 | $21,450 | $171,220 |
| 2014 | $1,175 | $202,390 | $21,450 | $180,940 |
Source: Public Records
Map
Nearby Homes
- 0 Cedarbrook Dr Unit 45
- 114 Cedar Ridge Loop
- 117 Grainger Ln
- 3925 Taylorsville Hwy
- 124 Smokestack Ln
- 648 Scotts Creek Rd
- 126 Penguin Ln
- 113 E Edinburgh Ct
- 599 Scotts Creek Rd
- 108 Red Cedar Ln
- 114 Red Cedar Ln
- 198 Castle Pines Ln
- 177 Titanium Dr
- 759 Lippard Farm Rd
- 154 Emma Ln
- 4320 Taylorsville Hwy
- 150 Forest Creek Dr
- 178 Zircon Dr
- 101 Titanium Dr
- 120 Rosy Apple Ln Unit 124
- 000 lot 9-20 Jo Monni Loop Unit 9-20
- 206 Jo Monni Loop
- 000 Jo Monni Loop Unit 73-76
- 000 Jo Monni Loop Unit 9-20
- 000 Jo Monni Loop Unit 81-84
- 000 Jo Monni Loop Unit 77-80
- 000 Jo Monni Loop
- 000 Jo Monni Loop Unit 52-57
- 77-80 Jo Monni Loop Unit 77-80
- 213 Jo Monni Loop
- 207 Jo Monni Loop
- 207 Jo Monni Loop Unit 109-116
- 194 Jo Monni Loop
- 254 Jo Monni Loop
- 199 Jo Monni Loop
- 243 Jo Monni Loop
- 237 Jo Monni Loop
- 160 Amanda Ln
- 255 Jo Monni Loop
- 184 Jo Monni Loop