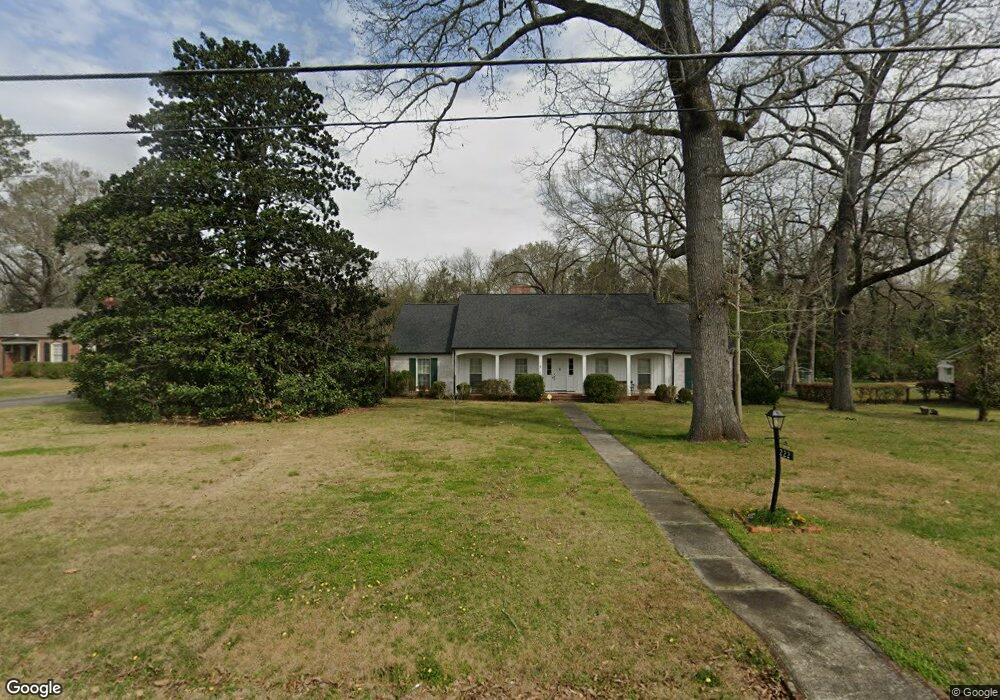
222 Jule Peek Ave Cedartown, GA 30125
Estimated Value: $422,940 - $499,000
4
Beds
4
Baths
3,918
Sq Ft
$117/Sq Ft
Est. Value
About This Home
This home is located at 222 Jule Peek Ave, Cedartown, GA 30125 and is currently estimated at $457,485, approximately $116 per square foot. 222 Jule Peek Ave is a home located in Polk County with nearby schools including Cedar Christian School and Vineyard Harvester Christian Academy.
Ownership History
Date
Name
Owned For
Owner Type
Purchase Details
Closed on
Oct 5, 2018
Sold by
Thomas Sara W
Bought by
Thomas Lyle B
Current Estimated Value
Purchase Details
Closed on
May 15, 1997
Sold by
Bruner William G and Alford Co- Nancy B
Bought by
Thomas Sara W
Purchase Details
Closed on
Feb 21, 1997
Sold by
Bruner William Gwathmey
Bought by
Bruner William G and Alfre Nancy B
Purchase Details
Closed on
Aug 31, 1993
Sold by
1St National Bk
Bought by
Bruner William G
Purchase Details
Closed on
Apr 18, 1990
Sold by
Bruner William G
Bought by
Bruner Ella R
Purchase Details
Closed on
Feb 8, 1990
Sold by
City Of Cedartown
Bought by
Bruner William G
Purchase Details
Closed on
Sep 3, 1963
Sold by
Bruner W G Mrs
Bought by
Bruner Ella Roberts
Purchase Details
Closed on
Jul 14, 1959
Bought by
Bruner W G Mrs
Create a Home Valuation Report for This Property
The Home Valuation Report is an in-depth analysis detailing your home's value as well as a comparison with similar homes in the area
Home Values in the Area
Average Home Value in this Area
Purchase History
| Date | Buyer | Sale Price | Title Company |
|---|---|---|---|
| Thomas Lyle B | -- | -- | |
| Thomas Sara W | $156,600 | -- | |
| Bruner William G | -- | -- | |
| Bruner William G | -- | -- | |
| Bruner William G | -- | -- | |
| Bruner Ella R | -- | -- | |
| Bruner William G | -- | -- | |
| Bruner Ella Roberts | -- | -- | |
| Bruner W G Mrs | -- | -- |
Source: Public Records
Tax History Compared to Growth
Tax History
| Year | Tax Paid | Tax Assessment Tax Assessment Total Assessment is a certain percentage of the fair market value that is determined by local assessors to be the total taxable value of land and additions on the property. | Land | Improvement |
|---|---|---|---|---|
| 2024 | $6,190 | $217,824 | $15,840 | $201,984 |
| 2023 | $3,596 | $126,261 | $15,840 | $110,421 |
| 2022 | $1,866 | $110,620 | $15,840 | $94,780 |
| 2021 | $2,611 | $110,620 | $15,840 | $94,780 |
| 2020 | $2,617 | $110,620 | $15,840 | $94,780 |
| 2019 | $2,095 | $80,023 | $5,897 | $74,126 |
| 2018 | $2,063 | $76,869 | $5,897 | $70,972 |
| 2017 | $2,037 | $76,869 | $5,897 | $70,972 |
| 2016 | $1,906 | $72,052 | $5,897 | $66,154 |
| 2015 | $1,838 | $69,356 | $5,897 | $63,459 |
| 2014 | $1,852 | $69,356 | $5,897 | $63,459 |
Source: Public Records
Map
Nearby Homes
- 214 Jule Peek Ave
- 607 N College St
- 443 N Cave Spring St
- 403 Lakeside Dr
- 422 Walnut St
- 408 N College St
- 521 W John Hand Rd
- 258 Chestnut St
- 305 N Cave Spring St
- 605 W Girard Ave
- 214 Victoria Ave
- 228 Marshall St
- 309 Walnut St
- 112 College Cir
- 144 Marshall St
- 207 John Phillips Rd
- 421 Wissahickon Ave
- 328 Mountain Home Rd
- 601 Mountain Home Rd
- 812 Blanche Rd
- 218 Jule Peek Ave
- 228 Jule Peek Ave
- 232 Jule Peek Ave
- 219 Jule Peek Ave
- 223 Jule Peek Ave
- 709 N College St
- 227 Jule Peek Ave
- 215 Jule Peek Ave
- 125 Northside Dr
- 213 Jule Peek Ave
- 301 Jule Peek Ave
- 705 N College St
- 715 N College St
- 619 N College St
- 121 Northside Dr
- 119 Northside Dr
- 336 Jule Peek Ave
- 721 N College St
- 721 N College St
- 615 N College St