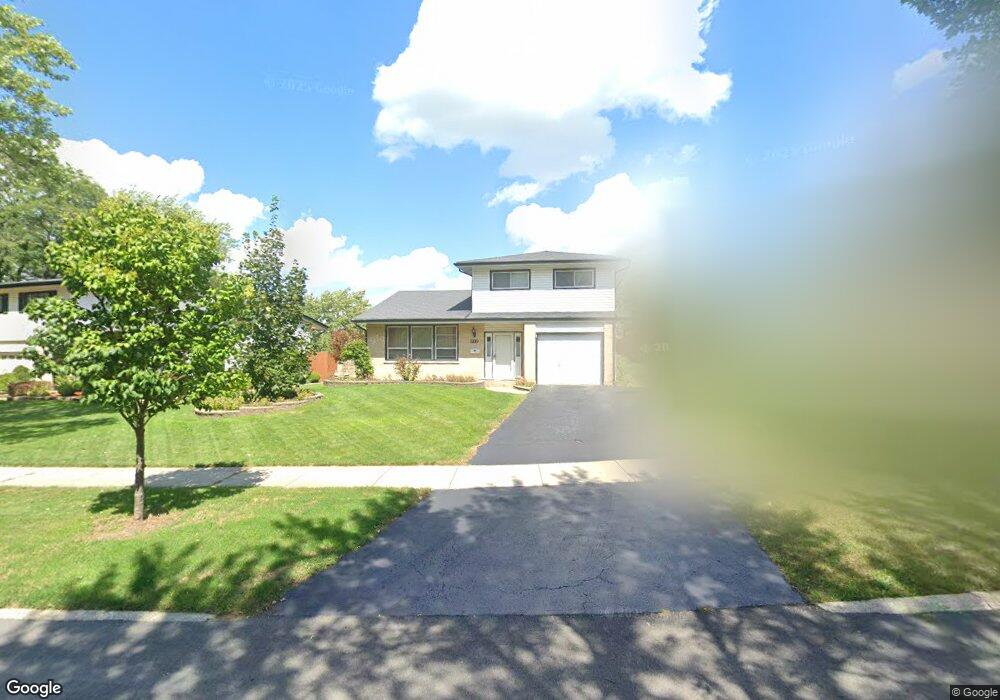
222 June Ln Lombard, IL 60148
South Lombard NeighborhoodEstimated Value: $361,000 - $432,000
--
Bed
--
Bath
1,714
Sq Ft
$232/Sq Ft
Est. Value
About This Home
This home is located at 222 June Ln, Lombard, IL 60148 and is currently estimated at $397,978, approximately $232 per square foot. 222 June Ln is a home located in DuPage County with nearby schools including Wm Hammerschmidt Elementary School, Madison Elementary School, and Butterfield Elementary School.
Ownership History
Date
Name
Owned For
Owner Type
Purchase Details
Closed on
Dec 12, 2009
Sold by
Singsuwan Nopporn Ed and Singsuwan Chittina Tina
Bought by
Declarati Singsuwan Nopporn Ed and Nopporn Ed Singsuwan Declaration Of Trus
Current Estimated Value
Home Financials for this Owner
Home Financials are based on the most recent Mortgage that was taken out on this home.
Original Mortgage
$430,500
Outstanding Balance
$242,982
Interest Rate
2.48%
Mortgage Type
Reverse Mortgage Home Equity Conversion Mortgage
Estimated Equity
$154,996
Purchase Details
Closed on
Nov 11, 2009
Sold by
Declarati Singsuwan Nopporn Ed
Bought by
Singsuwan Nopporn Ed and Singsuwan Chittina Tina
Home Financials for this Owner
Home Financials are based on the most recent Mortgage that was taken out on this home.
Original Mortgage
$430,500
Outstanding Balance
$242,982
Interest Rate
2.48%
Mortgage Type
Reverse Mortgage Home Equity Conversion Mortgage
Estimated Equity
$154,996
Purchase Details
Closed on
Jul 26, 2005
Sold by
Lasalle Bank Na
Bought by
Singsuwan Nopporn and Nopporn Ingsuwan Declaration Of Trust
Create a Home Valuation Report for This Property
The Home Valuation Report is an in-depth analysis detailing your home's value as well as a comparison with similar homes in the area
Home Values in the Area
Average Home Value in this Area
Purchase History
| Date | Buyer | Sale Price | Title Company |
|---|---|---|---|
| Declarati Singsuwan Nopporn Ed | -- | None Available | |
| Singsuwan Nopporn Ed | -- | None Available | |
| Singsuwan Nopporn | -- | -- |
Source: Public Records
Mortgage History
| Date | Status | Borrower | Loan Amount |
|---|---|---|---|
| Open | Singsuwan Nopporn Ed | $430,500 |
Source: Public Records
Tax History Compared to Growth
Tax History
| Year | Tax Paid | Tax Assessment Tax Assessment Total Assessment is a certain percentage of the fair market value that is determined by local assessors to be the total taxable value of land and additions on the property. | Land | Improvement |
|---|---|---|---|---|
| 2024 | $7,872 | $117,321 | $26,808 | $90,513 |
| 2023 | $7,438 | $108,490 | $24,790 | $83,700 |
| 2022 | $7,444 | $104,290 | $23,830 | $80,460 |
| 2021 | $7,201 | $101,700 | $23,240 | $78,460 |
| 2020 | $7,041 | $99,470 | $22,730 | $76,740 |
| 2019 | $6,667 | $94,570 | $21,610 | $72,960 |
| 2018 | $6,894 | $89,060 | $20,470 | $68,590 |
| 2017 | $6,699 | $84,870 | $19,510 | $65,360 |
| 2016 | $6,514 | $79,950 | $18,380 | $61,570 |
| 2015 | $6,152 | $74,480 | $17,120 | $57,360 |
| 2014 | $6,096 | $71,880 | $21,310 | $50,570 |
| 2013 | $6,003 | $72,890 | $21,610 | $51,280 |
Source: Public Records
Map
Nearby Homes
- 1313 S Rebecca Rd Unit 118A
- 1313 S Rebecca Rd Unit 113
- 1313 S Rebecca Rd Unit B111
- 120A Collen Dr Unit 105
- 120A Collen Dr Unit 202
- 1320 Lore Ln Unit 107B
- 1320A Lore Ln Unit 101
- 1520 S Elizabeth St
- 1324 S Main St
- 1419 Colony Ct
- 1311 S Finley Rd Unit 204
- 450 Manor Hill Ln
- 19W637 14th Place
- 111 E 13th St
- 484 Woodmoor Dr
- 451 S Garfield St
- 102 Norbury Ave
- 1450 S Stewart Ave
- 1621 S Highland Ave
- 1703 S Highland Ave
- 216 June Ln Unit 1
- 230 June Ln
- 225 Collen Dr
- 210 June Ln
- 223 June Ln
- 206 June Ln
- 219 Collen Dr
- 217 June Ln
- 240 Collen Dr
- 227 June Ln
- 231 June Ln
- 213 June Ln
- 200 June Ln
- 234 Collen Dr Unit 1
- 135 Collen Ct
- 228 Collen Dr
- 211 Collen Dr
- 212 Collen Ct Unit 101
- 212 Collen Ct Unit 107
- 212 Collen Ct Unit 115B