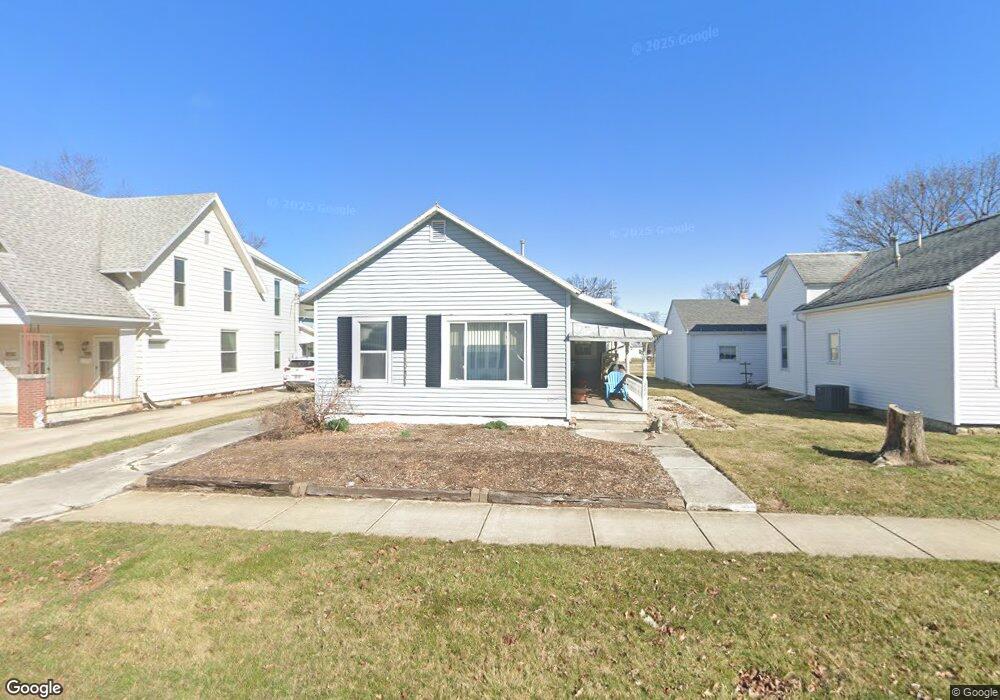
222 Locust St Findlay, OH 45840
Estimated Value: $144,000 - $195,000
1
Bed
1
Bath
1,563
Sq Ft
$113/Sq Ft
Est. Value
About This Home
This home is located at 222 Locust St, Findlay, OH 45840 and is currently estimated at $175,928, approximately $112 per square foot. 222 Locust St is a home located in Hancock County with nearby schools including Lincoln Elementary School, Donnell Middle School, and Findlay High School.
Ownership History
Date
Name
Owned For
Owner Type
Purchase Details
Closed on
Sep 1, 2017
Sold by
Paul Hal
Bought by
Paul Kurt
Current Estimated Value
Purchase Details
Closed on
Feb 24, 2000
Sold by
Day Sheldon W
Bought by
Paul Hal
Purchase Details
Closed on
Aug 19, 1991
Bought by
Day Sheldon W
Purchase Details
Closed on
Feb 27, 1989
Bought by
Ulrich Gary
Purchase Details
Closed on
Sep 1, 1987
Bought by
Pelphrey Jeffrey L
Create a Home Valuation Report for This Property
The Home Valuation Report is an in-depth analysis detailing your home's value as well as a comparison with similar homes in the area
Home Values in the Area
Average Home Value in this Area
Purchase History
| Date | Buyer | Sale Price | Title Company |
|---|---|---|---|
| Paul Kurt | -- | Whitman Title | |
| Paul Hal | $48,000 | -- | |
| Day Sheldon W | $44,400 | -- | |
| Ulrich Gary | $43,900 | -- | |
| Pelphrey Jeffrey L | $34,000 | -- |
Source: Public Records
Tax History
| Year | Tax Paid | Tax Assessment Tax Assessment Total Assessment is a certain percentage of the fair market value that is determined by local assessors to be the total taxable value of land and additions on the property. | Land | Improvement |
|---|---|---|---|---|
| 2024 | $1,603 | $45,120 | $7,670 | $37,450 |
| 2023 | $1,605 | $45,120 | $7,670 | $37,450 |
| 2022 | $1,600 | $45,120 | $7,670 | $37,450 |
| 2021 | $1,511 | $37,130 | $7,850 | $29,280 |
| 2020 | $1,511 | $37,130 | $7,850 | $29,280 |
| 2019 | $1,481 | $37,130 | $7,850 | $29,280 |
| 2018 | $1,368 | $31,440 | $5,530 | $25,910 |
| 2017 | $1,367 | $31,440 | $5,530 | $25,910 |
| 2016 | $1,354 | $31,440 | $5,530 | $25,910 |
| 2015 | $906 | $20,710 | $5,530 | $15,180 |
| 2014 | $906 | $20,710 | $5,530 | $15,180 |
| 2012 | $828 | $18,730 | $5,530 | $13,200 |
Source: Public Records
Map
Nearby Homes
- 423 Elm St
- 1113 Hurd Ave
- 412 Lima Ave
- 416 1/2 Lima Ave
- 865 S Main St
- 860 Hurd Ave
- 845 Hurd Ave
- 815 Liberty St
- 216 1st St
- 1304 Douglas Pkwy
- 123 Glendale Ave
- 324 W Mcpherson Ave
- 829 Maple Ave
- 206 Greenlawn Ave
- 514 Liberty St
- 527 W Sandusky St
- 315 Fairlawn Place
- 731 5th St
- 400 E Pearl St
- 407 Washington St
Your Personal Tour Guide
Ask me questions while you tour the home.