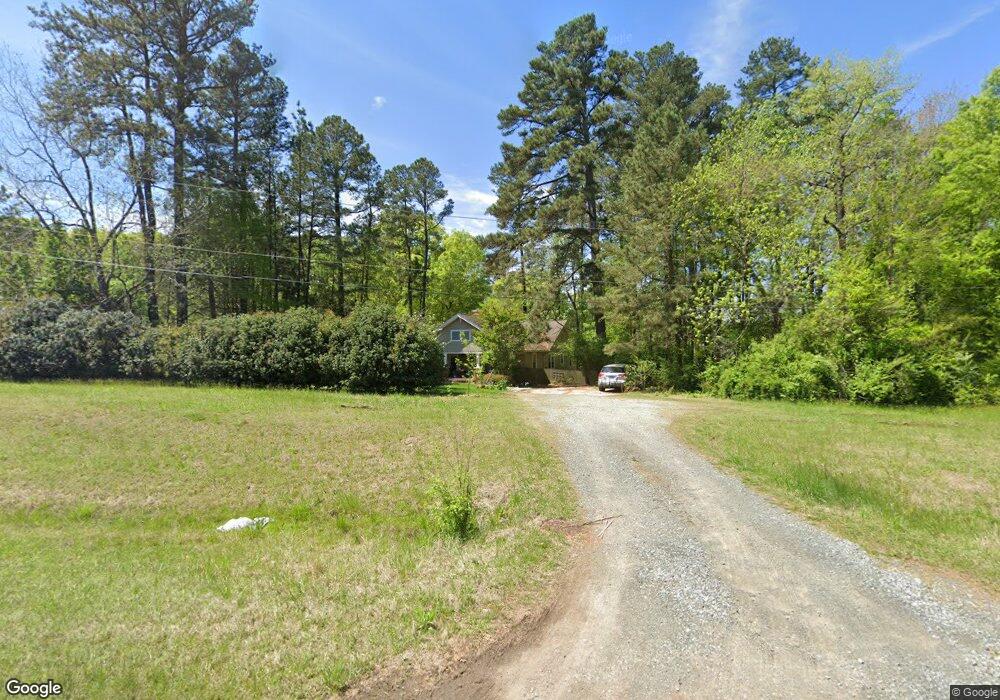
222 Morreene Rd Durham, NC 27705
West Durham NeighborhoodEstimated Value: $422,000 - $443,000
3
Beds
2
Baths
1,797
Sq Ft
$239/Sq Ft
Est. Value
About This Home
This home is located at 222 Morreene Rd, Durham, NC 27705 and is currently estimated at $429,928, approximately $239 per square foot. 222 Morreene Rd is a home located in Durham County with nearby schools including Morehead Montessori, Forest View Elementary, and Brogden Middle.
Ownership History
Date
Name
Owned For
Owner Type
Purchase Details
Closed on
May 22, 2020
Sold by
Meyers Benjamin P and Meyers Laura P
Bought by
Viswanathan Vyas T
Current Estimated Value
Home Financials for this Owner
Home Financials are based on the most recent Mortgage that was taken out on this home.
Original Mortgage
$257,400
Outstanding Balance
$226,084
Interest Rate
3.3%
Mortgage Type
New Conventional
Estimated Equity
$203,844
Purchase Details
Closed on
May 15, 2018
Sold by
Meyers Kathryn A
Bought by
Meyers Benjamin P and Meyers Laura P
Home Financials for this Owner
Home Financials are based on the most recent Mortgage that was taken out on this home.
Original Mortgage
$144,000
Interest Rate
4.37%
Mortgage Type
Adjustable Rate Mortgage/ARM
Purchase Details
Closed on
May 23, 2003
Sold by
Meyers Family Investments Llc
Bought by
Meyers Kathryn A
Create a Home Valuation Report for This Property
The Home Valuation Report is an in-depth analysis detailing your home's value as well as a comparison with similar homes in the area
Home Values in the Area
Average Home Value in this Area
Purchase History
| Date | Buyer | Sale Price | Title Company |
|---|---|---|---|
| Viswanathan Vyas T | $286,000 | None Available | |
| Meyers Benjamin P | $160,000 | None Available | |
| Meyers Kathryn A | -- | -- |
Source: Public Records
Mortgage History
| Date | Status | Borrower | Loan Amount |
|---|---|---|---|
| Open | Viswanathan Vyas T | $257,400 | |
| Previous Owner | Meyers Benjamin P | $144,000 |
Source: Public Records
Tax History
| Year | Tax Paid | Tax Assessment Tax Assessment Total Assessment is a certain percentage of the fair market value that is determined by local assessors to be the total taxable value of land and additions on the property. | Land | Improvement |
|---|---|---|---|---|
| 2025 | $4,015 | $405,072 | $147,000 | $258,072 |
| 2024 | $2,765 | $198,211 | $54,975 | $143,236 |
| 2023 | $2,596 | $198,211 | $54,975 | $143,236 |
| 2022 | $2,537 | $198,211 | $54,975 | $143,236 |
| 2021 | $2,525 | $198,211 | $54,975 | $143,236 |
| 2020 | $2,466 | $198,211 | $54,975 | $143,236 |
| 2019 | $2,466 | $198,211 | $54,975 | $143,236 |
| 2018 | $1,909 | $140,726 | $36,675 | $104,051 |
| 2017 | $1,895 | $140,726 | $36,675 | $104,051 |
| 2016 | $1,831 | $140,726 | $36,675 | $104,051 |
| 2015 | $1,165 | $84,141 | $23,113 | $61,028 |
| 2014 | $1,165 | $84,141 | $23,113 | $61,028 |
Source: Public Records
Map
Nearby Homes
- 50 Galway Glenn Ln
- 13 Providence Ct
- 19 Providence Ct
- 409 Morreene Rd
- 128 Galway Glenn Ln
- 74 Forest Oaks Dr
- 22 Durbin Place
- 300 Vincent Ave
- 512 Soapstone Dr
- 516 Soapstone Dr
- 504 Soapstone Dr
- 508 Soapstone Dr
- 4 Astor Ct
- 4111 Talcott Dr
- 3737 Medford Rd
- 6 Intuition Cir
- 112 Mt Evans Dr
- 710 Constitution Dr Unit 206
- 710 Constitution Dr Unit A
- 3716 Medford Rd
- 10 Ezekiel St
- 8 Ezekiel St
- 14 Ezekiel St
- 6 Ezekiel St
- 16 Ezekiel St
- 111 Whitfield Rd
- 4 Ezekiel St
- 18 Ezekiel St
- 214 Morreene Rd
- 20 Ezekiel St
- 22 Ezekiel St
- 2 Ezekiel St
- 113 Whitfield Rd
- 115 Whitfield Rd
- 306 Morreene Rd
- 310 Morreene Rd Apartment A
- 117 Whitfield Rd
- 3 Galway Glenn Ln
- 7 Galway Glenn Ln
- 1 Galway Glenn Ln
Your Personal Tour Guide
Ask me questions while you tour the home.