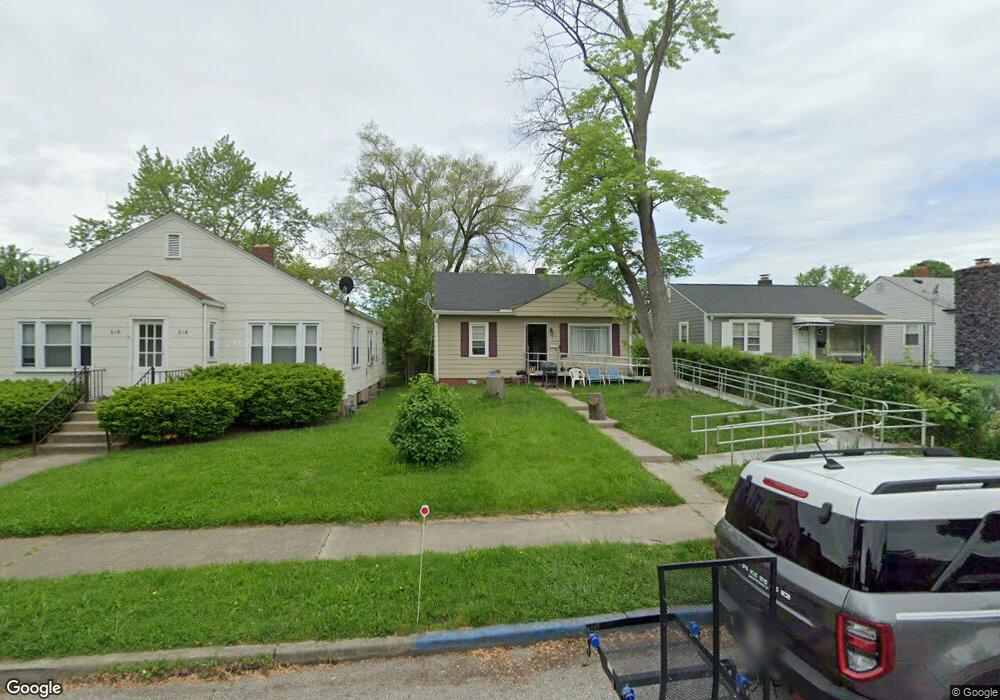
222 N 6th Ave Beech Grove, IN 46107
Estimated Value: $130,000 - $176,000
3
Beds
2
Baths
696
Sq Ft
$222/Sq Ft
Est. Value
About This Home
This home is located at 222 N 6th Ave, Beech Grove, IN 46107 and is currently estimated at $154,511, approximately $221 per square foot. 222 N 6th Ave is a home located in Marion County with nearby schools including Hornet Park Elementary School, Central Elementary School, and South Grove Intermediate School.
Ownership History
Date
Name
Owned For
Owner Type
Purchase Details
Closed on
Jul 28, 2010
Sold by
Secretary Of Housing & Urban Development
Bought by
Saylor Brian J
Current Estimated Value
Purchase Details
Closed on
Jun 9, 2010
Sold by
Citimortgage Inc
Bought by
Secretary Of Housing & Urban Development
Purchase Details
Closed on
Jan 28, 2010
Sold by
Cortez Alberto
Bought by
Citimortgage Inc
Create a Home Valuation Report for This Property
The Home Valuation Report is an in-depth analysis detailing your home's value as well as a comparison with similar homes in the area
Home Values in the Area
Average Home Value in this Area
Purchase History
| Date | Buyer | Sale Price | Title Company |
|---|---|---|---|
| Saylor Brian J | -- | None Available | |
| Secretary Of Housing & Urban Development | -- | None Available | |
| Citimortgage Inc | $78,376 | None Available |
Source: Public Records
Tax History Compared to Growth
Tax History
| Year | Tax Paid | Tax Assessment Tax Assessment Total Assessment is a certain percentage of the fair market value that is determined by local assessors to be the total taxable value of land and additions on the property. | Land | Improvement |
|---|---|---|---|---|
| 2024 | $2,633 | $87,200 | $18,000 | $69,200 |
| 2023 | $2,633 | $94,400 | $18,000 | $76,400 |
| 2022 | $2,446 | $85,500 | $18,000 | $67,500 |
| 2021 | $2,030 | $73,300 | $18,000 | $55,300 |
| 2020 | $1,775 | $68,200 | $18,000 | $50,200 |
| 2019 | $1,452 | $57,900 | $10,800 | $47,100 |
| 2018 | $1,336 | $55,200 | $10,800 | $44,400 |
| 2017 | $1,296 | $51,800 | $10,800 | $41,000 |
| 2016 | $1,244 | $50,200 | $10,800 | $39,400 |
| 2014 | $1,175 | $50,000 | $10,800 | $39,200 |
| 2013 | $572 | $50,000 | $10,800 | $39,200 |
Source: Public Records
Map
Nearby Homes