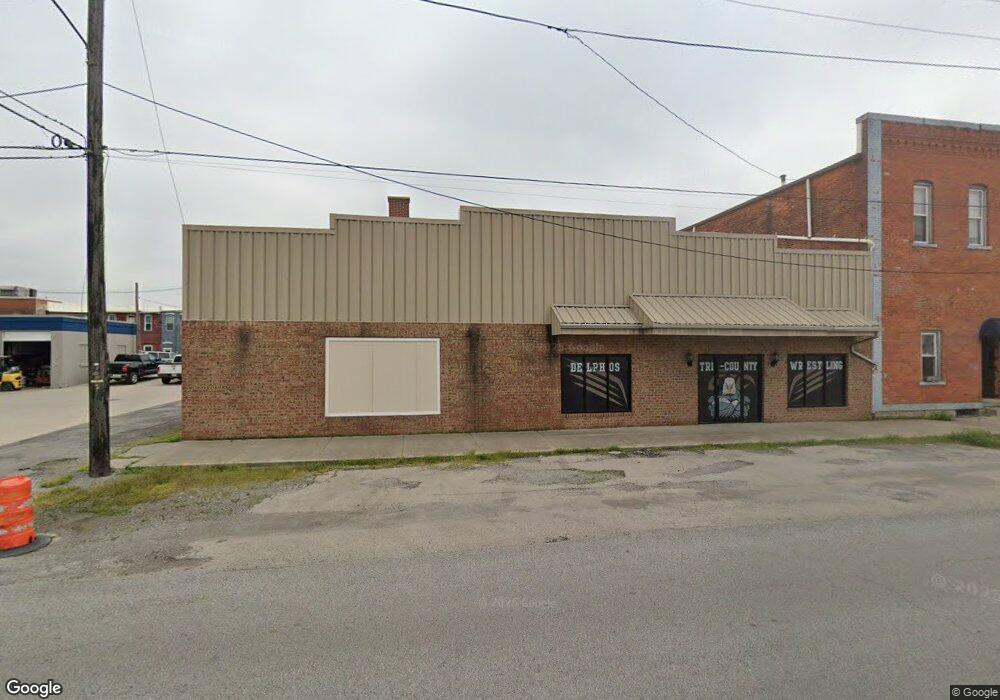
222 N Canal St Delphos, OH 45833
Estimated Value: $246,730
--
Bed
2
Baths
8,976
Sq Ft
$27/Sq Ft
Est. Value
About This Home
This home is located at 222 N Canal St, Delphos, OH 45833 and is currently estimated at $246,730, approximately $27 per square foot. 222 N Canal St is a home located in Van Wert County with nearby schools including Delphos St. John's High School and Delphos St. John's Elementary School.
Ownership History
Date
Name
Owned For
Owner Type
Purchase Details
Closed on
Mar 11, 2017
Sold by
Four Bs Real Estate
Bought by
Slippery Fish Llc
Current Estimated Value
Home Financials for this Owner
Home Financials are based on the most recent Mortgage that was taken out on this home.
Original Mortgage
$113,600
Outstanding Balance
$94,256
Interest Rate
4.19%
Mortgage Type
Commercial
Estimated Equity
$146,359
Purchase Details
Closed on
Jul 8, 1999
Bought by
Four B'S Real Estate (Pr
Purchase Details
Closed on
Apr 14, 1994
Bought by
Place George C
Create a Home Valuation Report for This Property
The Home Valuation Report is an in-depth analysis detailing your home's value as well as a comparison with similar homes in the area
Home Values in the Area
Average Home Value in this Area
Purchase History
| Date | Buyer | Sale Price | Title Company |
|---|---|---|---|
| Slippery Fish Llc | $142,000 | Attorney | |
| Four B'S Real Estate (Pr | $75,000 | -- | |
| Place George C | $55,000 | -- |
Source: Public Records
Mortgage History
| Date | Status | Borrower | Loan Amount |
|---|---|---|---|
| Open | Slippery Fish Llc | $113,600 |
Source: Public Records
Tax History Compared to Growth
Tax History
| Year | Tax Paid | Tax Assessment Tax Assessment Total Assessment is a certain percentage of the fair market value that is determined by local assessors to be the total taxable value of land and additions on the property. | Land | Improvement |
|---|---|---|---|---|
| 2024 | $2,316 | $46,340 | $3,320 | $43,020 |
| 2023 | $2,316 | $46,340 | $3,320 | $43,020 |
| 2022 | $2,036 | $36,330 | $2,560 | $33,770 |
| 2021 | $2,041 | $36,330 | $2,560 | $33,770 |
| 2020 | $2,052 | $36,330 | $2,560 | $33,770 |
| 2019 | $1,878 | $36,330 | $2,560 | $33,770 |
| 2018 | $1,832 | $36,330 | $2,560 | $33,770 |
| 2017 | $1,818 | $36,330 | $2,560 | $33,770 |
| 2016 | $1,831 | $36,640 | $2,560 | $34,080 |
| 2015 | $1,821 | $36,640 | $2,560 | $34,080 |
| 2014 | $1,752 | $36,640 | $2,560 | $34,080 |
| 2013 | $1,734 | $36,640 | $2,560 | $34,080 |
Source: Public Records
Map
Nearby Homes
- 210 E 3rd St
- 221 S Main St
- 405 N Franklin St
- 424 S Canal St
- 409 N Bredeick St
- 610 N Washington St
- 503 W 6th St
- 616 W 5th St
- 604 W 6th St
- 704 N Franklin St
- 628 N Pierce St
- 606 S Cass St
- 508 S Washington St
- 633 E 2nd St
- 634 S Clay St
- 810 N Franklin St
- 821 E 3rd St
- 650 E 6th St
- 903 E 3rd St
- 914 E 3rd St