222 Pine St Nashua, NH 03060
South End Nashua NeighborhoodEstimated Value: $479,557 - $528,000
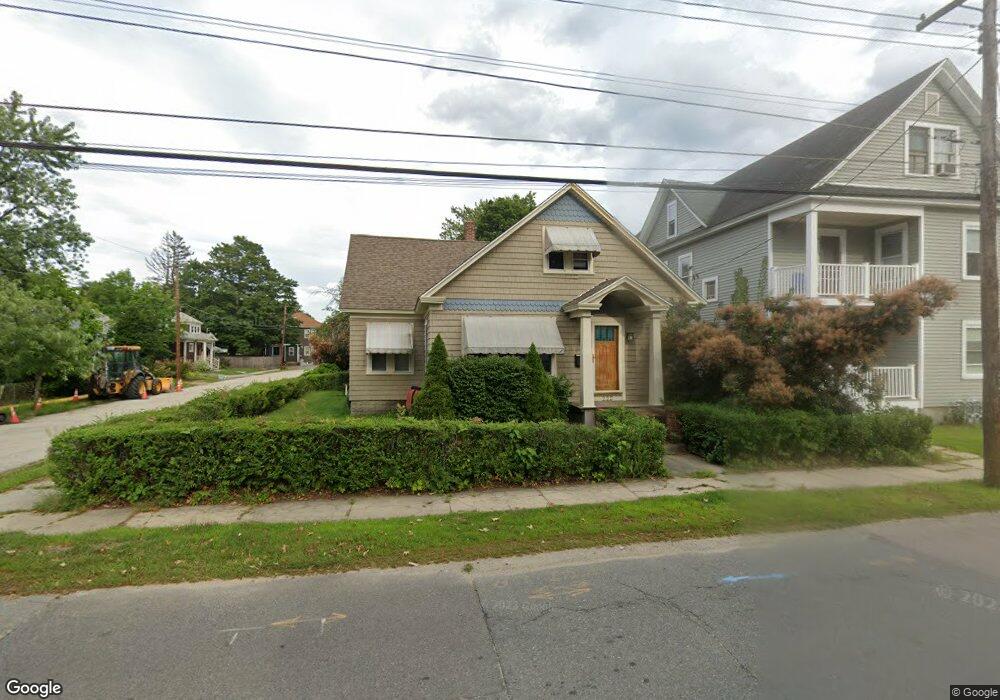
About This Home
This home is located at 222 Pine St, Nashua, NH 03060 and is currently estimated at $508,139, approximately $248 per square foot. 222 Pine St is a home located in Hillsborough County with nearby schools including Fairgrounds Elementary School, Elm Street Middle School, and Nashua High School South.
Ownership History
We collect this data history from publicly available records. To have your information removed, we recommend requesting removal directly through your county’s website.
Purchase Details
Home Values in the Area
Average Home Value in this Area
Purchase History
We collect this data history from publicly available records. To have your information removed, we recommend requesting removal directly through your county’s website.
| Date | Buyer | Sale Price | Title Company |
|---|---|---|---|
| $10,900 | -- |
Mortgage History
We collect this data history from publicly available records. To have your information removed, we recommend requesting removal directly through your county’s website.
| Date | Status | Borrower | Loan Amount |
|---|---|---|---|
| Open | $50,000 |
Tax History
We collect this data history from publicly available records. To have your information removed, we recommend requesting removal directly through your county’s website.
| Year | Tax Paid | Tax Assessment Tax Assessment Total Assessment is a certain percentage of the fair market value that is determined by local assessors to be the total taxable value of land and additions on the property. | Land | Improvement |
|---|---|---|---|---|
| 2025 | $6,688 | $397,400 | $120,200 | $277,200 |
| 2024 | $6,319 | $397,400 | $120,200 | $277,200 |
| 2023 | $6,391 | $350,600 | $96,200 | $254,400 |
| 2022 | $6,335 | $350,600 | $96,200 | $254,400 |
| 2021 | $5,187 | $223,400 | $64,100 | $159,300 |
| 2020 | $5,051 | $223,400 | $64,100 | $159,300 |
| 2019 | $4,861 | $223,400 | $64,100 | $159,300 |
| 2018 | $4,738 | $223,400 | $64,100 | $159,300 |
| 2017 | $4,348 | $168,600 | $63,900 | $104,700 |
| 2016 | $4,227 | $168,600 | $63,900 | $104,700 |
| 2015 | $4,136 | $168,600 | $63,900 | $104,700 |
| 2014 | $4,055 | $168,600 | $63,900 | $104,700 |
Map
- 21 Acton St Unit 45
- 51 Nagle St
- 33 Ross St
- 20 Lawndale Ave
- 1b Balcom St
- 3 Pratt St
- 98 Vine St
- 61 Almont St
- 3 Sawyer St
- 101 Blossom St
- 12 Burnett St Unit 115116
- 24 Blanchard St
- 18 Fifield St
- 14 Mulberry St
- 95 Harbor Ave Unit 5
- 160 W Hollis St Unit B
- 169A W Hollis St Unit 193
- 18-20 Maple St
- 7-9 Harbor Ave
- 27 Eastman St Unit 6062
Ask me questions while you tour the home.