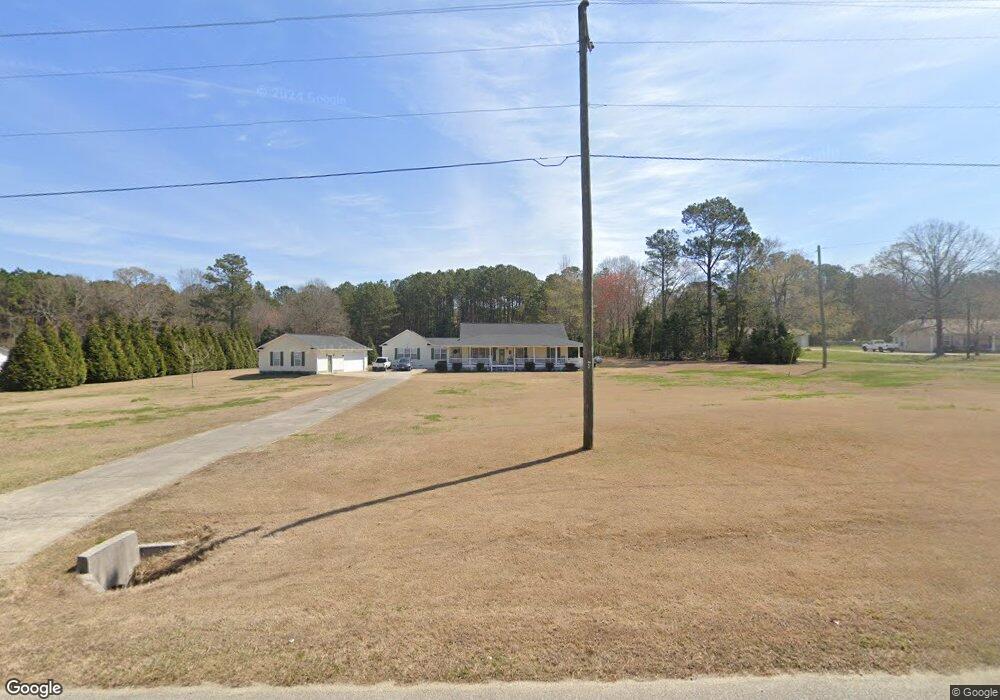
222 Runyon Loop Cedartown, GA 30125
Estimated Value: $348,218 - $416,000
4
Beds
3
Baths
2,269
Sq Ft
$168/Sq Ft
Est. Value
About This Home
This home is located at 222 Runyon Loop, Cedartown, GA 30125 and is currently estimated at $380,805, approximately $167 per square foot. 222 Runyon Loop is a home located in Polk County.
Ownership History
Date
Name
Owned For
Owner Type
Purchase Details
Closed on
Apr 3, 2012
Sold by
Brown Henry R
Bought by
Brown Henry R and Brown Amy S
Current Estimated Value
Purchase Details
Closed on
Sep 22, 2010
Sold by
Jpmc Specialty Mortgage Llc
Bought by
Brown Henry R and Brown Amy S*
Home Financials for this Owner
Home Financials are based on the most recent Mortgage that was taken out on this home.
Original Mortgage
$93,000
Interest Rate
4.42%
Mortgage Type
New Conventional
Purchase Details
Closed on
Jul 6, 2010
Sold by
Williams Stanley
Bought by
Jpmc Specialty Mtg Llc
Purchase Details
Closed on
Aug 23, 2006
Sold by
Williams Stanley
Bought by
Williams Stanley
Home Financials for this Owner
Home Financials are based on the most recent Mortgage that was taken out on this home.
Original Mortgage
$187,850
Interest Rate
6.67%
Mortgage Type
New Conventional
Purchase Details
Closed on
Jun 19, 1997
Sold by
Allen Judy Atkins
Bought by
Tant Russell D and Tant Kristie D
Create a Home Valuation Report for This Property
The Home Valuation Report is an in-depth analysis detailing your home's value as well as a comparison with similar homes in the area
Purchase History
| Date | Buyer | Sale Price | Title Company |
|---|---|---|---|
| Brown Henry R | $155,000 | -- | |
| Brown Henry R | $155,000 | -- | |
| Jpmc Specialty Mtg Llc | $119,136 | -- | |
| Williams Stanley | $221,000 | -- | |
| Brown Henry R | $221,000 | -- | |
| Tant Russell D | -- | -- |
Source: Public Records
Mortgage History
| Date | Status | Borrower | Loan Amount |
|---|---|---|---|
| Previous Owner | Brown Henry R | $93,000 | |
| Previous Owner | Brown Henry R | $187,850 |
Source: Public Records
Tax History
| Year | Tax Paid | Tax Assessment Tax Assessment Total Assessment is a certain percentage of the fair market value that is determined by local assessors to be the total taxable value of land and additions on the property. | Land | Improvement |
|---|---|---|---|---|
| 2025 | $2,475 | $140,229 | $11,083 | $129,146 |
| 2024 | $2,298 | $124,670 | $6,926 | $117,744 |
| 2023 | $1,591 | $80,414 | $6,926 | $73,488 |
| 2022 | $1,273 | $67,034 | $4,618 | $62,416 |
| 2021 | $1,290 | $67,034 | $4,618 | $62,416 |
| 2020 | $1,292 | $67,034 | $4,618 | $62,416 |
| 2019 | $1,389 | $65,066 | $4,618 | $60,448 |
| 2018 | $1,295 | $60,333 | $4,618 | $55,715 |
| 2017 | $1,274 | $60,333 | $4,618 | $55,715 |
| 2016 | $1,242 | $59,136 | $3,421 | $55,715 |
| 2015 | $1,276 | $60,354 | $3,421 | $56,933 |
| 2014 | $1,604 | $60,354 | $3,421 | $56,933 |
Source: Public Records
Map
Nearby Homes
- 176 Runyon Loop
- 0 Runyon Loop Unit 10606366
- 0 Runyon Loop Unit 7650113
- 0 Hightower Falls Rd Unit 7746466
- 0 Hightower Falls Rd Unit 7746481
- 0 Hightower Falls Rd Unit 7746485
- 0 Hightower Falls Rd Unit 7746462
- 0 Hightower Falls Rd Unit 7746476
- 0 Hightower Falls Rd Unit 7746451
- 0 Hightower Falls Rd Unit 7745623
- 435 Hampton Rd
- 0 Everett Mtn Rd
- 600 Grady Rd
- 0 Hightower Rd Unit 10584768
- 0 Hightower Rd Unit 7633002
- 0 Hightower Rd Unit 10584778
- 0 Hightower Rd Unit 7632982
- 394 Knight Rd
- 1706 Antioch Rd
- 247 Grady Rd
- 246 Runyon Loop
- 276 Runyon Loop
- 198 Runyon Loop
- 239 Runyon Loop
- 212 Runyon Loop
- 212 Runyon Loop
- 166 Runyon Loop
- 171 Runyon Loop
- 367 Runyon Loop
- 156 Runyon Loop
- 136 Runyon Loop
- 146 Runyon Loop
- 323 Runyon Loop
- 159 Runyon Loop
- 326 Runyon Loop
- 126 Runyon Loop
- 116 Runyon Loop
- 115 Runyon Loop
- 86 Runyon Loop
- 83 Runyon Loop
Your Personal Tour Guide
Ask me questions while you tour the home.