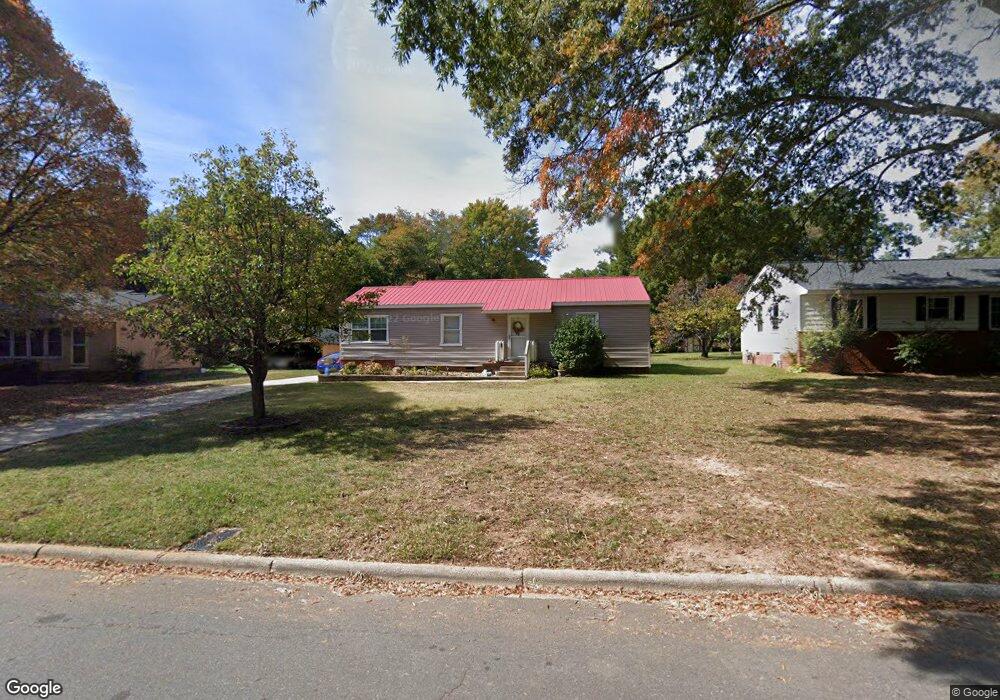
222 S Milford Dr Salisbury, NC 28144
Estimated Value: $190,000 - $237,028
3
Beds
2
Baths
1,224
Sq Ft
$170/Sq Ft
Est. Value
About This Home
This home is located at 222 S Milford Dr, Salisbury, NC 28144 and is currently estimated at $207,757, approximately $169 per square foot. 222 S Milford Dr is a home located in Rowan County with nearby schools including H D Isenberg Elementary, Knox Middle School, and North Rowan Middle School.
Ownership History
Date
Name
Owned For
Owner Type
Purchase Details
Closed on
Sep 22, 2015
Sold by
Espinoza Sandra Aguilar
Bought by
Espinoza Sandra Aguilar and Serna Richardo Medrano
Current Estimated Value
Purchase Details
Closed on
Sep 18, 2015
Sold by
Carrington Mortgage Services Llc
Bought by
Espinoza Sandra Aguilar
Purchase Details
Closed on
Dec 19, 2014
Sold by
Stephens Christopher E and Stephens Barbara Jo
Bought by
Carrington Mortgage Services Llc
Purchase Details
Closed on
May 15, 2008
Sold by
Stephens Carole Goodman and Stephens Leslie D
Bought by
Stephens Christopher E
Home Financials for this Owner
Home Financials are based on the most recent Mortgage that was taken out on this home.
Original Mortgage
$81,545
Interest Rate
5.86%
Mortgage Type
FHA
Purchase Details
Closed on
May 24, 2007
Sold by
Stephens Carole Goodman
Bought by
Stephens Carole Goodman and Stephens Leslie D
Create a Home Valuation Report for This Property
The Home Valuation Report is an in-depth analysis detailing your home's value as well as a comparison with similar homes in the area
Home Values in the Area
Average Home Value in this Area
Purchase History
| Date | Buyer | Sale Price | Title Company |
|---|---|---|---|
| Espinoza Sandra Aguilar | -- | None Available | |
| Espinoza Sandra Aguilar | -- | None Available | |
| Carrington Mortgage Services Llc | $120,221 | None Available | |
| Stephens Christopher E | $103,000 | None Available | |
| Stephens Carole Goodman | -- | None Available |
Source: Public Records
Mortgage History
| Date | Status | Borrower | Loan Amount |
|---|---|---|---|
| Previous Owner | Stephens Christopher E | $81,545 |
Source: Public Records
Tax History Compared to Growth
Tax History
| Year | Tax Paid | Tax Assessment Tax Assessment Total Assessment is a certain percentage of the fair market value that is determined by local assessors to be the total taxable value of land and additions on the property. | Land | Improvement |
|---|---|---|---|---|
| 2025 | $1,642 | $137,331 | $21,750 | $115,581 |
| 2024 | $1,642 | $137,331 | $21,750 | $115,581 |
| 2023 | $1,642 | $137,331 | $21,750 | $115,581 |
| 2022 | $1,352 | $98,197 | $20,010 | $78,187 |
| 2021 | $1,352 | $98,197 | $20,010 | $78,187 |
| 2020 | $1,352 | $98,197 | $20,010 | $78,187 |
| 2019 | $1,352 | $98,197 | $20,010 | $78,187 |
| 2018 | $1,128 | $83,055 | $20,010 | $63,045 |
| 2017 | $1,123 | $83,055 | $20,010 | $63,045 |
| 2016 | $1,092 | $83,055 | $20,010 | $63,045 |
| 2015 | $1,130 | $83,055 | $20,010 | $63,045 |
| 2014 | -- | $90,820 | $20,010 | $70,810 |
Source: Public Records
Map
Nearby Homes
- 1521 W Colonial Dr
- 1638 W Colonial Dr
- 1441 Statesville Blvd
- 103 Spring Dr
- 1300 Larchmont Place Unit 208
- 1300 Larchmont Place Unit 107
- 1300 Larchmont Place
- 1300 Larchmont Place Unit 210
- 1612 Statesville Blvd
- 1317 Arden Dr
- 207 N Milford Dr
- 1218 Forestdale Dr
- 1931 Calvin Ave
- BEAUMONT Plan at Milford Terrace
- 306 N Milford Dr
- 305 N Milford Dr
- 636 Statesville Blvd
- 523 Riviera Dr
- 519 Riviera Dr
- 401 Wellington Hills Cir
- 224 S Milford Dr
- 220 S Milford Dr
- 212 S Milford Dr
- 228 S Milford Dr
- 229 S Milford Dr
- 211 S Milford Dr
- 230 S Milford Dr
- 231 S Milford Dr
- 217 S Milford Dr
- 200 S Milford Dr
- 1600 Wiltshire Rd
- 233 S Milford Dr
- 201 S Milford Dr
- 250 S Milford Dr
- 1604 Wiltshire Rd
- 235 S Milford Dr
- 1511 Wiltshire Rd
- 256 S Milford Dr
- 253 S Milford Dr
- 160 S Milford Dr