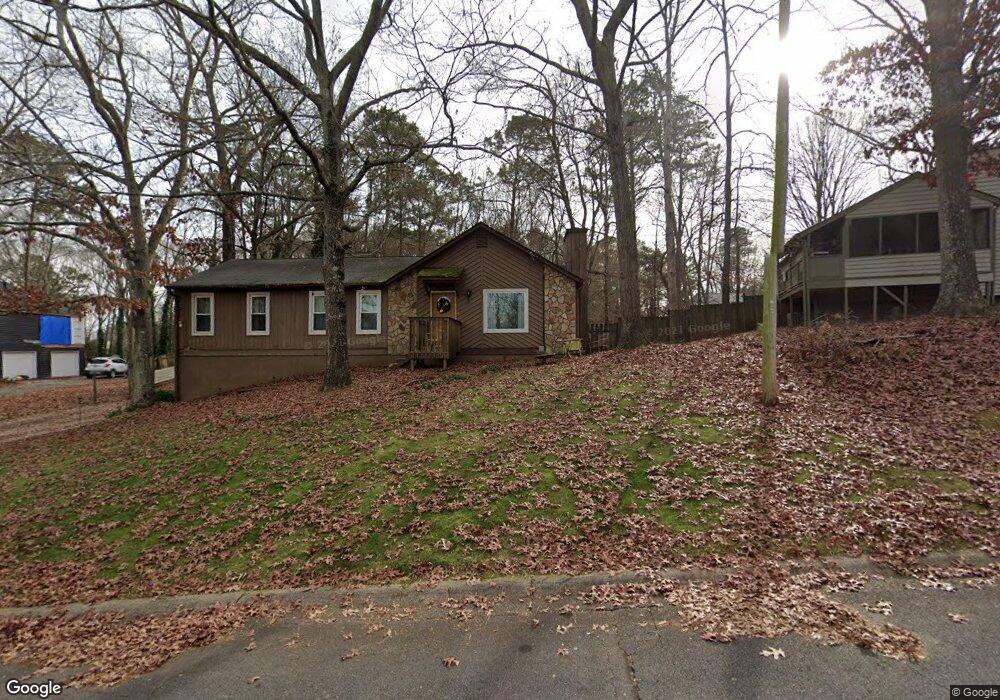
222 Shalloway Dr NE Unit 1 Kennesaw, GA 30144
Estimated Value: $328,228 - $442,000
3
Beds
2
Baths
1,352
Sq Ft
$271/Sq Ft
Est. Value
About This Home
This home is located at 222 Shalloway Dr NE Unit 1, Kennesaw, GA 30144 and is currently estimated at $366,807, approximately $271 per square foot. 222 Shalloway Dr NE Unit 1 is a home located in Cobb County with nearby schools including Blackwell Elementary School, McCleskey Middle School, and Kell High School.
Ownership History
Date
Name
Owned For
Owner Type
Purchase Details
Closed on
Nov 3, 1998
Sold by
Aames Capital Corp
Bought by
Cook Andrea Celestre
Current Estimated Value
Home Financials for this Owner
Home Financials are based on the most recent Mortgage that was taken out on this home.
Original Mortgage
$88,350
Outstanding Balance
$19,386
Interest Rate
6.65%
Estimated Equity
$347,421
Purchase Details
Closed on
Apr 7, 1998
Sold by
Shirkley Ken
Bought by
Aames Capital Corp
Purchase Details
Closed on
Jul 25, 1996
Sold by
Allain Deborah Lee
Bought by
Shirley Ken
Purchase Details
Closed on
Mar 14, 1994
Sold by
Stout Paul M Joanna
Bought by
Allian Dennis L Deborah
Home Financials for this Owner
Home Financials are based on the most recent Mortgage that was taken out on this home.
Original Mortgage
$80,860
Interest Rate
7.61%
Mortgage Type
FHA
Create a Home Valuation Report for This Property
The Home Valuation Report is an in-depth analysis detailing your home's value as well as a comparison with similar homes in the area
Home Values in the Area
Average Home Value in this Area
Purchase History
| Date | Buyer | Sale Price | Title Company |
|---|---|---|---|
| Cook Andrea Celestre | $93,000 | -- | |
| Aames Capital Corp | $68,883 | -- | |
| Shirley Ken | $10,000 | -- | |
| Allian Dennis L Deborah | $7,000 | -- |
Source: Public Records
Mortgage History
| Date | Status | Borrower | Loan Amount |
|---|---|---|---|
| Open | Cook Andrea Celestre | $88,350 | |
| Previous Owner | Allian Dennis L Deborah | $80,860 | |
| Closed | Allian Dennis L Deborah | $3,749 |
Source: Public Records
Tax History Compared to Growth
Tax History
| Year | Tax Paid | Tax Assessment Tax Assessment Total Assessment is a certain percentage of the fair market value that is determined by local assessors to be the total taxable value of land and additions on the property. | Land | Improvement |
|---|---|---|---|---|
| 2024 | $2,931 | $130,376 | $30,000 | $100,376 |
| 2023 | $2,098 | $117,008 | $30,000 | $87,008 |
| 2022 | $2,132 | $92,792 | $18,000 | $74,792 |
| 2021 | $1,710 | $73,508 | $16,000 | $57,508 |
| 2020 | $1,568 | $67,012 | $14,000 | $53,012 |
| 2019 | $1,568 | $67,012 | $14,000 | $53,012 |
| 2018 | $1,568 | $67,012 | $14,000 | $53,012 |
| 2017 | $1,206 | $52,904 | $16,000 | $36,904 |
| 2016 | $1,208 | $52,904 | $16,000 | $36,904 |
| 2015 | $921 | $40,108 | $17,600 | $22,508 |
| 2014 | $929 | $40,108 | $0 | $0 |
Source: Public Records
Map
Nearby Homes
- 163 Castleair Ct NE
- 2111 Yorkshire Ct
- 2108 Yorkshire Ct
- 4992 Shallow Ridge Rd NE
- 1816 Yorkshire Dr
- 4904 Shallow Creek Trail NW
- 4903 Shallow Creek Trail NW
- 0 Watkins Glen Dr NE Unit 10506865
- 0 Watkins Glen Dr NE Unit 7564156
- 0 Lake Latimer Dr NE Unit 10506857
- 44 Lake Latimer Dr NE
- 46 Lake Latimer Dr NE
- 48 Lake Latimer Dr NE
- 0 Lake Latimer Dr NE Unit 7564947
- 510 Cooper Ln
- 414 Delancy Dr
- 162 Ridgewood Dr
- 221 Ellis Ln
- 4978 Dana Dr NE
- 230 Shalloway Dr NE
- 237 Shalloway Dr NE Unit 1
- 4972 Dana Dr NE Unit 2
- 238 Shalloway Dr NE
- 205 Shalloway Dr NE
- 246 Shalloway Dr NE
- 259 Shalloway Dr NE
- 4968 Dana Dr NE
- 258 Shalloway Dr NE
- 277 Shalloway Dr NE Unit 1
- 5015 Ridgewald Ct NE
- 4960 Dana Dr NE
- 5011 Ridgewald Ct NE
- 0 Castleair Dr NE Unit 7498677
- 0 Castleair Dr NE Unit 7332534
- 0 Castleair Dr NE Unit 7283353
- 0 Castleair Dr NE Unit 7220514
- 0 Castleair Dr NE Unit 7202454
- 0 Castleair Dr NE Unit 7108906