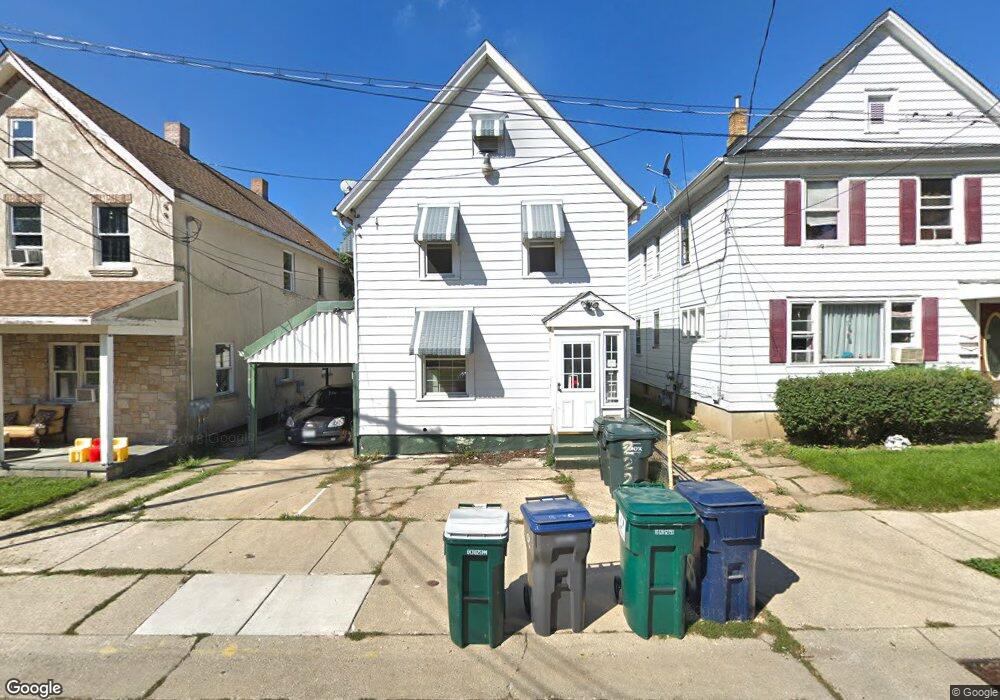
222 Sherman Place Waukegan, IL 60085
Downtown Waukegan NeighborhoodEstimated Value: $195,000 - $242,000
4
Beds
2
Baths
1,648
Sq Ft
$131/Sq Ft
Est. Value
About This Home
This home is located at 222 Sherman Place, Waukegan, IL 60085 and is currently estimated at $215,643, approximately $130 per square foot. 222 Sherman Place is a home located in Lake County with nearby schools including Miguel Juarez Middle School, Waukegan High School, and Most Blessed Trinity Academy.
Ownership History
Date
Name
Owned For
Owner Type
Purchase Details
Closed on
Nov 2, 2017
Sold by
County Of Lake
Bought by
Olivares Olivia
Current Estimated Value
Purchase Details
Closed on
Nov 17, 2005
Sold by
Mcbride Hiram R
Bought by
Valdez Agustin A
Home Financials for this Owner
Home Financials are based on the most recent Mortgage that was taken out on this home.
Original Mortgage
$135,000
Interest Rate
9.9%
Mortgage Type
Unknown
Purchase Details
Closed on
Sep 15, 2003
Sold by
Mcbride Rosemary A
Bought by
Mcbride Hiram R
Create a Home Valuation Report for This Property
The Home Valuation Report is an in-depth analysis detailing your home's value as well as a comparison with similar homes in the area
Home Values in the Area
Average Home Value in this Area
Purchase History
| Date | Buyer | Sale Price | Title Company |
|---|---|---|---|
| Olivares Olivia | -- | None Available | |
| Valdez Agustin A | $150,000 | First American Title Ins Co | |
| Mcbride Hiram R | -- | -- |
Source: Public Records
Mortgage History
| Date | Status | Borrower | Loan Amount |
|---|---|---|---|
| Previous Owner | Valdez Agustin A | $135,000 |
Source: Public Records
Tax History Compared to Growth
Tax History
| Year | Tax Paid | Tax Assessment Tax Assessment Total Assessment is a certain percentage of the fair market value that is determined by local assessors to be the total taxable value of land and additions on the property. | Land | Improvement |
|---|---|---|---|---|
| 2024 | $4,044 | $52,261 | $6,110 | $46,151 |
| 2023 | $3,689 | $42,890 | $5,014 | $37,876 |
| 2022 | $3,689 | $37,731 | $5,023 | $32,708 |
| 2021 | $3,363 | $32,257 | $4,311 | $27,946 |
| 2020 | $3,406 | $30,051 | $4,016 | $26,035 |
| 2019 | $3,428 | $27,537 | $3,680 | $23,857 |
| 2018 | $2,539 | $19,638 | $4,166 | $15,472 |
| 2017 | $2,471 | $17,374 | $3,686 | $13,688 |
| 2016 | $2,333 | $15,097 | $3,203 | $11,894 |
| 2015 | $2,282 | $13,512 | $2,867 | $10,645 |
| 2014 | $2,210 | $18,603 | $2,632 | $15,971 |
| 2012 | $2,959 | $20,155 | $2,852 | $17,303 |
Source: Public Records
Map
Nearby Homes
- 426 Julian St
- 28 N Saint James St
- 452 North Ave
- 222 Grand Ave
- 613 Washington St
- 428 N Poplar St
- 511 Chestnut St
- 557 W Water St
- 522 N Poplar St
- 23 N Jackson St
- 702 Franklin St
- 610 Bluff St
- 620 N Poplar St
- 325 4th St
- 215 S Park Ave
- 611 N Genesee St
- 723 N County St
- 613 Clarke Ave
- 304 Powell Ave
- 502 Belvidere Rd
- 218 Sherman Place
- 224 Sherman Place
- 216 Sherman Place
- 210 Sherman Place
- 208 Sherman Place
- 529 Grand Ave
- 217 Sherman Place
- 217 Sherman Place Unit 1
- 217 Sherman Place Unit 2
- 223 Sherman Place
- 223 Sherman Place Unit 1
- 221 Sherman Place
- 219 Sherman Place
- 209 Sherman Place
- 213 Sherman Place
- 204 Sherman Place
- 204 Sherman Place Unit 3
- 520 W Clayton St
- 518 W Clayton St
- 216 N West St