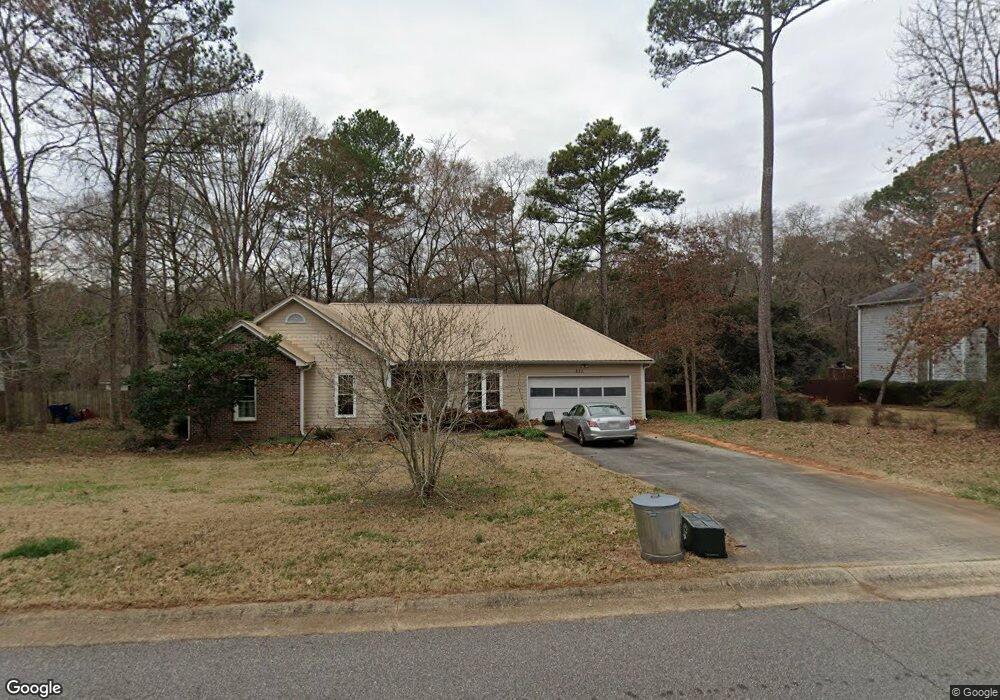
222 Stonybrook Cir Athens, GA 30605
Estimated Value: $316,821 - $322,000
3
Beds
2
Baths
1,540
Sq Ft
$207/Sq Ft
Est. Value
About This Home
This home is located at 222 Stonybrook Cir, Athens, GA 30605 and is currently estimated at $318,955, approximately $207 per square foot. 222 Stonybrook Cir is a home located in Clarke County with nearby schools including Barnett Shoals Elementary School, Hilsman Middle School, and Cedar Shoals High School.
Ownership History
Date
Name
Owned For
Owner Type
Purchase Details
Closed on
May 18, 2009
Sold by
Bertelli Anthony M
Bought by
Coppins Wayne
Current Estimated Value
Home Financials for this Owner
Home Financials are based on the most recent Mortgage that was taken out on this home.
Original Mortgage
$116,720
Outstanding Balance
$73,269
Interest Rate
4.81%
Mortgage Type
New Conventional
Estimated Equity
$245,686
Purchase Details
Closed on
Jun 11, 2004
Sold by
Hassell Faye W
Bought by
Bertelli Anthony M
Purchase Details
Closed on
Dec 11, 1998
Sold by
Paulson Billy G
Bought by
Hassell Faye W
Purchase Details
Closed on
Jul 15, 1997
Sold by
Calvert William M and Salmon William J
Bought by
Paulson Billy G
Purchase Details
Closed on
Dec 13, 1995
Sold by
Wright J L Jr & Rod Wright Dba Wright
Bought by
Calvert William M and Salmo William J
Purchase Details
Closed on
Jun 13, 1995
Sold by
Brookstone Subdivision Inc
Bought by
Wright J L Jr & Rod Wright Dba Wright
Create a Home Valuation Report for This Property
The Home Valuation Report is an in-depth analysis detailing your home's value as well as a comparison with similar homes in the area
Home Values in the Area
Average Home Value in this Area
Purchase History
| Date | Buyer | Sale Price | Title Company |
|---|---|---|---|
| Coppins Wayne | $145,900 | -- | |
| Bertelli Anthony M | $134,500 | -- | |
| Hassell Faye W | $114,900 | -- | |
| Paulson Billy G | $102,000 | -- | |
| Calvert William M | $93,900 | -- | |
| Wright J L Jr & Rod Wright Dba Wright | $14,000 | -- |
Source: Public Records
Mortgage History
| Date | Status | Borrower | Loan Amount |
|---|---|---|---|
| Open | Coppins Wayne | $116,720 |
Source: Public Records
Tax History Compared to Growth
Tax History
| Year | Tax Paid | Tax Assessment Tax Assessment Total Assessment is a certain percentage of the fair market value that is determined by local assessors to be the total taxable value of land and additions on the property. | Land | Improvement |
|---|---|---|---|---|
| 2025 | $3,047 | $117,079 | $12,000 | $105,079 |
| 2024 | $3,047 | $109,381 | $12,000 | $97,381 |
| 2023 | $2,161 | $104,138 | $12,000 | $92,138 |
| 2022 | $2,858 | $89,606 | $10,400 | $79,206 |
| 2021 | $2,415 | $71,676 | $10,400 | $61,276 |
| 2020 | $1,806 | $63,592 | $10,400 | $53,192 |
| 2019 | $1,716 | $60,548 | $10,400 | $50,148 |
| 2018 | $1,596 | $57,002 | $10,400 | $46,602 |
| 2017 | $1,390 | $50,944 | $10,400 | $40,544 |
| 2016 | $1,293 | $48,083 | $10,400 | $37,683 |
| 2015 | $1,311 | $48,549 | $10,400 | $38,149 |
| 2014 | $1,312 | $48,522 | $10,400 | $38,122 |
Source: Public Records
Map
Nearby Homes
- 123 Stonybrook Ct
- 145 Myles Ct
- 153 Stonybrook Ct
- 345 Richard Way
- 375 Brookstone Dr
- 200 Wiltshire Dr
- 309 Twin Creek Shores
- 355 Discovery Trail
- 365 Discovery Trail
- 350 Discovery Trail
- 0 Williamsburg Ln Unit Lot 5
- 0 Williamsburg Ln Unit Lot 7
- 0 Williamsburg Ln Unit Lot 6
- 439 River Chase Dr
- 440 Wood Ln
- 150 Greenwood Ln
- 0 Barnett Shoals Rd Unit Lot 2
- 212 Stonybrook Cir
- 232 Stonybrook Cir Unit n/a
- 232 Stonybrook Cir
- 5095 Barnett Shoals Rd
- 000 Barnett Shoals Rd
- 2825/75 Barnett Shoals Rd
- 1455 Barnett Shoals Rd
- 4333 Barnett Shoals Rd
- 211 Stonybrook Cir
- 202 Stonybrook Cir
- 242 Stonybrook Cir
- 231 Stonybrook Cir
- 221 Stonybrook Cir
- 201 Stonybrook Cir
- 201 Stonybrook Cir Unit APPLEBY DR
- 585 Brookstone Dr
- 252 Stonybrook Cir
- 251 Stonybrook Cir
- 191 Stonybrook Cir
- 555 Brookstone Dr