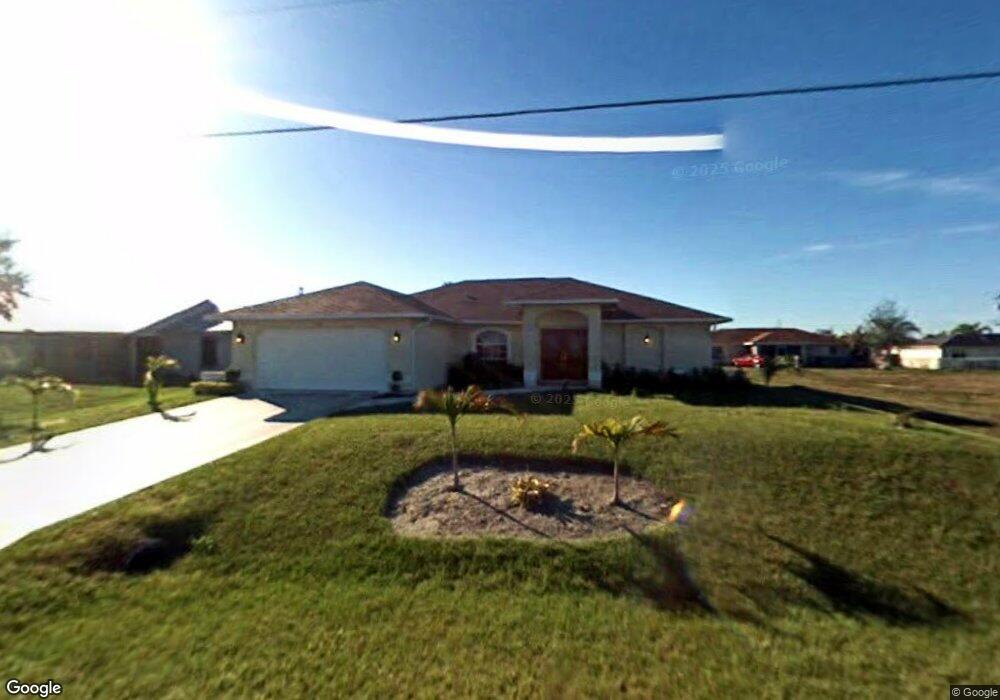
222 SW 13th St Cape Coral, FL 33991
Hancock NeighborhoodEstimated Value: $300,273 - $383,000
4
Beds
2
Baths
1,846
Sq Ft
$182/Sq Ft
Est. Value
About This Home
This home is located at 222 SW 13th St, Cape Coral, FL 33991 and is currently estimated at $336,318, approximately $182 per square foot. 222 SW 13th St is a home located in Lee County with nearby schools including Caloosa Elementary School, Tropic Isles Elementary School, and Hancock Creek Elementary School.
Ownership History
Date
Name
Owned For
Owner Type
Purchase Details
Closed on
Oct 17, 2014
Sold by
Lantigua Reyna and Lantigua Reina
Bought by
Aamm Investments Llc
Current Estimated Value
Home Financials for this Owner
Home Financials are based on the most recent Mortgage that was taken out on this home.
Original Mortgage
$60,000
Outstanding Balance
$46,117
Interest Rate
4.17%
Mortgage Type
Stand Alone First
Estimated Equity
$290,201
Purchase Details
Closed on
Dec 30, 2011
Sold by
Figueroa Yaquelin and Fernandez Jose
Bought by
Lantigua Reina
Purchase Details
Closed on
Sep 30, 2005
Sold by
Sabo Paul W and Sabo Carolyn M
Bought by
Figueroa Yaqueline
Home Financials for this Owner
Home Financials are based on the most recent Mortgage that was taken out on this home.
Original Mortgage
$57,659
Interest Rate
5.66%
Mortgage Type
Stand Alone Second
Purchase Details
Closed on
Jul 22, 2004
Sold by
Dodd Margaret B
Bought by
Sabo Paul W and Sabo Carolyn M
Create a Home Valuation Report for This Property
The Home Valuation Report is an in-depth analysis detailing your home's value as well as a comparison with similar homes in the area
Home Values in the Area
Average Home Value in this Area
Purchase History
| Date | Buyer | Sale Price | Title Company |
|---|---|---|---|
| Aamm Investments Llc | -- | First Integrity Title Inc | |
| Lantigua Reina | $78,000 | First Integrity Title Inc | |
| Figueroa Yaqueline | $288,300 | Jm Title Corporation | |
| Sabo Paul W | $43,000 | Platinum Land Title Agency I |
Source: Public Records
Mortgage History
| Date | Status | Borrower | Loan Amount |
|---|---|---|---|
| Open | Aamm Investments Llc | $60,000 | |
| Previous Owner | Figueroa Yaqueline | $57,659 | |
| Previous Owner | Figueroa Yaqueline | $230,637 |
Source: Public Records
Tax History Compared to Growth
Tax History
| Year | Tax Paid | Tax Assessment Tax Assessment Total Assessment is a certain percentage of the fair market value that is determined by local assessors to be the total taxable value of land and additions on the property. | Land | Improvement |
|---|---|---|---|---|
| 2025 | $5,836 | $247,341 | $66,215 | $170,546 |
| 2024 | $5,706 | $254,185 | -- | -- |
| 2023 | $5,706 | $231,077 | $0 | $0 |
| 2022 | $5,167 | $210,070 | $0 | $0 |
| 2021 | $4,825 | $191,709 | $37,057 | $154,652 |
| 2020 | $4,592 | $173,612 | $24,800 | $148,812 |
| 2019 | $4,467 | $170,391 | $20,000 | $150,391 |
| 2018 | $4,379 | $161,492 | $20,000 | $141,492 |
| 2017 | $4,208 | $150,997 | $12,000 | $138,997 |
| 2016 | $3,965 | $132,950 | $20,552 | $112,398 |
| 2015 | $3,824 | $123,806 | $16,113 | $107,693 |
| 2014 | -- | $107,600 | $7,050 | $100,550 |
| 2013 | -- | $95,695 | $4,800 | $90,895 |
Source: Public Records
Map
Nearby Homes
- 213 SW 13th Terrace
- 1318 SW 2nd Ave
- 1318 SW 4th Ave
- 118 SW 13th St
- 225 SW 12th Terrace
- 1306 SW 4th Place
- 115 SW 12th Terrace
- 1414 SW 1st Place
- 207 SW 12th St
- 1418 SW 1st Place
- 208 SW 15th St
- 1410 SW 1st Ave
- 1401 SW First Ave
- 1222 SW Santa Barbara Place
- 1214 SW Santa Barbara Place
- 309 SW 15th Terrace
- 1013 SW 4th Place
- 1008 SW 4th Place
- 1511 SW 4th Place
- 106 SW 11th Terrace
- 302 SW 13th St
- 221 SW 13th Terrace
- 218 SW 13th St
- 303 SW 13th Terrace
- 217 SW 13th Terrace
- 219 SW 13th St
- 301 SW 13th St
- 308 SW 13th St
- 305 SW 13th St
- 1241 SW 3rd Ave
- 209 SW 13th Terrace
- 311 SW 13th Terrace
- 314 SW 13th St
- 208 SW 13th St
- 222 SW 13th Terrace
- 1232 SW 2nd Place
- 319 SW 13th Terrace
- 1239 SW 2nd Place
- 1248 SW 3rd Ave