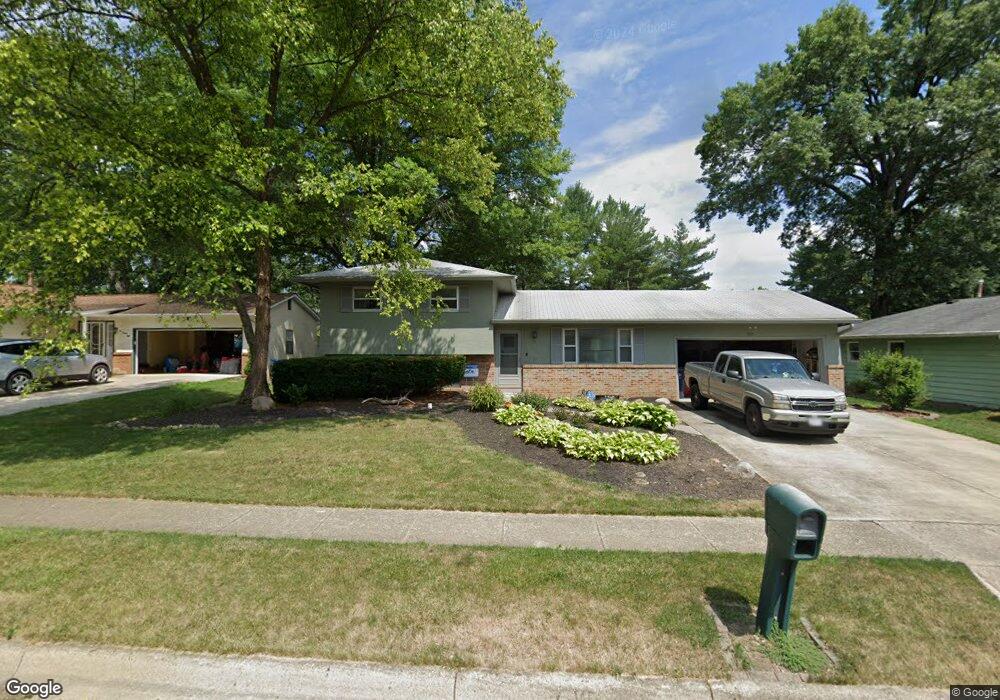
222 Trafalgar Ct Columbus, OH 43230
Estimated Value: $219,000 - $335,000
4
Beds
2
Baths
1,084
Sq Ft
$266/Sq Ft
Est. Value
About This Home
This home is located at 222 Trafalgar Ct, Columbus, OH 43230 and is currently estimated at $287,899, approximately $265 per square foot. 222 Trafalgar Ct is a home located in Franklin County with nearby schools including Chapelfield Elementary School, Gahanna West Middle School, and Lincoln High School.
Ownership History
Date
Name
Owned For
Owner Type
Purchase Details
Closed on
Jul 16, 2021
Sold by
Mautz Billie K
Bought by
Atchley James E
Current Estimated Value
Home Financials for this Owner
Home Financials are based on the most recent Mortgage that was taken out on this home.
Original Mortgage
$137,362
Interest Rate
2.8%
Mortgage Type
FHA
Purchase Details
Closed on
Jun 22, 2007
Sold by
Atchley James E
Bought by
Atchley James E and Mautz Billie K
Purchase Details
Closed on
Dec 14, 2004
Sold by
Atchley Lisa L
Bought by
Atchley James E
Purchase Details
Closed on
Jun 30, 1998
Sold by
Killilea Terrance J and Killilea Ann E
Bought by
Atchley James E and Atchley Lisa L
Home Financials for this Owner
Home Financials are based on the most recent Mortgage that was taken out on this home.
Original Mortgage
$117,515
Interest Rate
7.18%
Mortgage Type
FHA
Purchase Details
Closed on
Nov 15, 1989
Purchase Details
Closed on
Sep 28, 1987
Create a Home Valuation Report for This Property
The Home Valuation Report is an in-depth analysis detailing your home's value as well as a comparison with similar homes in the area
Home Values in the Area
Average Home Value in this Area
Purchase History
| Date | Buyer | Sale Price | Title Company |
|---|---|---|---|
| Atchley James E | $91,500 | None Listed On Document | |
| Atchley James E | $75,400 | Attorney | |
| Atchley James E | -- | -- | |
| Atchley James E | $119,000 | -- | |
| -- | $87,000 | -- | |
| -- | $77,500 | -- |
Source: Public Records
Mortgage History
| Date | Status | Borrower | Loan Amount |
|---|---|---|---|
| Previous Owner | Atchley James E | $137,362 | |
| Previous Owner | Atchley James E | $117,515 |
Source: Public Records
Tax History Compared to Growth
Tax History
| Year | Tax Paid | Tax Assessment Tax Assessment Total Assessment is a certain percentage of the fair market value that is determined by local assessors to be the total taxable value of land and additions on the property. | Land | Improvement |
|---|---|---|---|---|
| 2024 | $5,042 | $85,580 | $23,940 | $61,640 |
| 2023 | $4,978 | $85,575 | $23,940 | $61,635 |
| 2022 | $4,783 | $64,050 | $16,870 | $47,180 |
| 2021 | $4,626 | $64,050 | $16,870 | $47,180 |
| 2020 | $4,587 | $64,050 | $16,870 | $47,180 |
| 2019 | $3,831 | $53,380 | $14,070 | $39,310 |
| 2018 | $3,617 | $53,380 | $14,070 | $39,310 |
| 2017 | $3,472 | $53,380 | $14,070 | $39,310 |
| 2016 | $3,428 | $47,400 | $12,500 | $34,900 |
| 2015 | $3,431 | $47,400 | $12,500 | $34,900 |
| 2014 | $3,405 | $47,400 | $12,500 | $34,900 |
| 2013 | $1,691 | $47,390 | $12,495 | $34,895 |
Source: Public Records
Map
Nearby Homes
- 404 Foxwood Dr
- 343 Imperial Dr
- 278 Empire Dr
- 470 Deerwood Ave E
- 3610 N Stygler Rd
- 600 Agler Rd
- 221 Lincolnshire Rd
- 175 Stonegate Cir
- 463 Lincolnshire Rd
- 206 Lintner St
- 364 Morgan Ln
- 390 Dunbarton Rd
- 668 Kenilworth Ct
- 427 Amesbury Dr
- 642 Ridenour Rd
- 3888 Agler Rd
- 2741 Acarie Dr
- 373 Lyncroft Dr
- 209 Springbrook Place
- 536 Springwood Lake Dr
- 216 Trafalgar Ct
- 228 Trafalgar Ct
- 208 Trafalgar Ct
- 223 Moorfield Dr
- 217 Moorfield Dr
- 240 Trafalgar Ct
- 231 Moorfield Dr
- 219 Trafalgar Ct
- 227 Trafalgar Ct
- 209 Moorfield Dr
- 303 Watling Rd
- 213 Trafalgar Ct
- 235 Trafalgar Ct
- 200 Trafalgar Ct
- 201 Moorfield Dr
- 337 Watling Rd
- 295 Watling Rd
- 203 Trafalgar Ct
- 196 Trafalgar Ct
- 195 Moorfield Dr