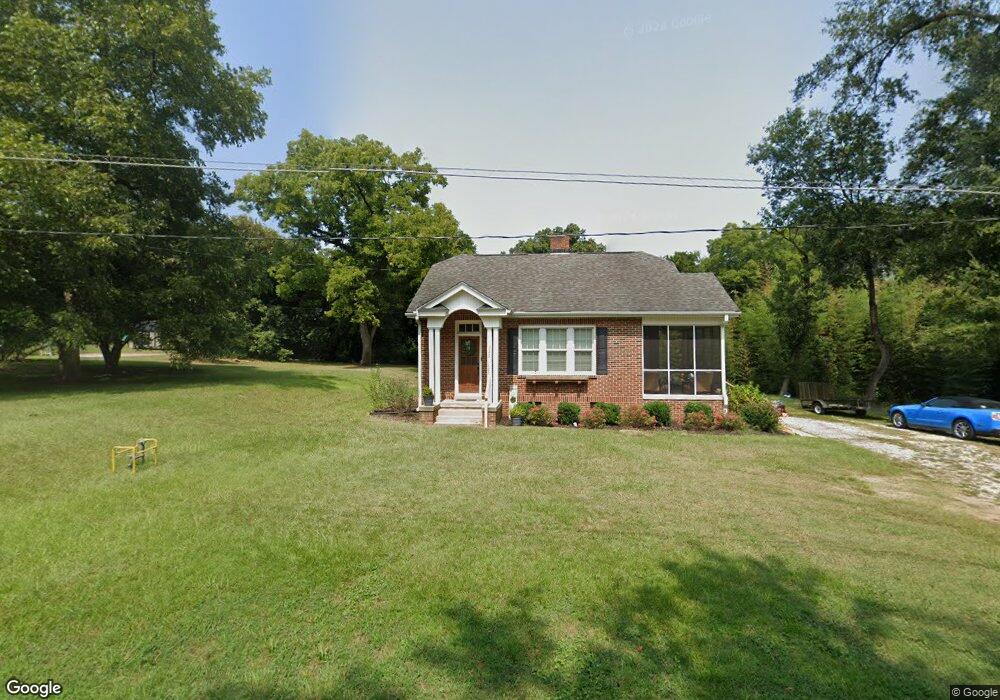
222 W Main St Ninety Six, SC 29666
Estimated Value: $153,000 - $201,000
2
Beds
1
Bath
1,356
Sq Ft
$128/Sq Ft
Est. Value
About This Home
This home is located at 222 W Main St, Ninety Six, SC 29666 and is currently estimated at $173,747, approximately $128 per square foot. 222 W Main St is a home with nearby schools including Ninety Six Primary School, Ninety Six Elementary School, and Edgewood Middle School.
Ownership History
Date
Name
Owned For
Owner Type
Purchase Details
Closed on
Jun 1, 2022
Sold by
Chaney Sarah C
Bought by
Long Alexa and Long Corbie N
Current Estimated Value
Home Financials for this Owner
Home Financials are based on the most recent Mortgage that was taken out on this home.
Original Mortgage
$133,333
Outstanding Balance
$126,677
Interest Rate
5.1%
Mortgage Type
New Conventional
Estimated Equity
$47,070
Purchase Details
Closed on
May 31, 2019
Sold by
Mcclanahan Julia Ann and Mcclanahan Zachary Tyler
Bought by
Chaney Sarah C
Home Financials for this Owner
Home Financials are based on the most recent Mortgage that was taken out on this home.
Original Mortgage
$87,878
Interest Rate
4.25%
Mortgage Type
FHA
Purchase Details
Closed on
May 13, 2016
Sold by
Werts Francis M and Werts James H
Bought by
Pridmore Julia Ann and Mcclanahan Zachary Tyler
Purchase Details
Closed on
May 19, 2010
Sold by
Estate Of Lillie H Werts
Bought by
Werts Frances M and Werts James H
Create a Home Valuation Report for This Property
The Home Valuation Report is an in-depth analysis detailing your home's value as well as a comparison with similar homes in the area
Home Values in the Area
Average Home Value in this Area
Purchase History
| Date | Buyer | Sale Price | Title Company |
|---|---|---|---|
| Long Alexa | $85,000 | None Listed On Document | |
| Chaney Sarah C | $89,500 | None Available | |
| Pridmore Julia Ann | $35,000 | None Available | |
| Werts Frances M | -- | -- |
Source: Public Records
Mortgage History
| Date | Status | Borrower | Loan Amount |
|---|---|---|---|
| Open | Long Alexa | $133,333 | |
| Previous Owner | Chaney Sarah C | $87,878 |
Source: Public Records
Tax History Compared to Growth
Tax History
| Year | Tax Paid | Tax Assessment Tax Assessment Total Assessment is a certain percentage of the fair market value that is determined by local assessors to be the total taxable value of land and additions on the property. | Land | Improvement |
|---|---|---|---|---|
| 2024 | $1,651 | $5,000 | $0 | $0 |
| 2023 | $1,651 | $7,500 | $0 | $0 |
| 2022 | $1,162 | $3,400 | $0 | $0 |
| 2021 | $1,095 | $3,400 | $0 | $0 |
| 2020 | $1,091 | $3,400 | $0 | $0 |
| 2019 | $885 | $2,580 | $0 | $0 |
| 2018 | $875 | $64,500 | $7,500 | $57,000 |
| 2017 | $1,757 | $64,500 | $7,500 | $57,000 |
| 2016 | $1,290 | $46,300 | $7,500 | $38,800 |
| 2015 | $1,289 | $46,300 | $7,500 | $38,800 |
| 2014 | -- | $2,780 | $0 | $0 |
| 2010 | -- | $45,500 | $6,900 | $38,600 |
Source: Public Records
Map
Nearby Homes
- 118 118 West Main St Ninety Six
- 406 N Church St
- 107 Gervais St
- 431 S Cambridge St
- 214 Lowell St
- 203 Allis Ave
- 322 Poplar Hill Rd
- 0 Enoree Church Road (6 08 Acres)
- 512 Poplar Hill Rd
- 606 Magnolia Dr
- 203 Ramp Rd
- 133 Gunnery Ct W
- 335 Arsenal Dr
- 305 Pullham Rd
- 306 Links Crossing S
- 320 Arsenal Dr
- 122 Gunnery Ct W
- 1806 N Hwy 246
- 116 W Gunnery Ct
- 306 Arsenal Dr
- 228 W Main St
- 219 W Main St
- 223 W Main St
- 212 W Main St
- 109 N Church St
- Lot C2 N Main St
- Lot C1 N Main St
- -- N Main St
- 217 W Main St
- 225 W Main St
- 230 W Main St
- 215 W Main St
- 208 W Main St
- 227 W Main St
- 105 Ashley Oaks Ln
- 229 W Main St
- 207 Main St W
- 107 Ashley Oaks Ln
- 116&118 Ashley Oaks Ln
- 206 W Main St