Estimated Value: $437,000 - $504,000
4
Beds
3
Baths
2,016
Sq Ft
$228/Sq Ft
Est. Value
About This Home
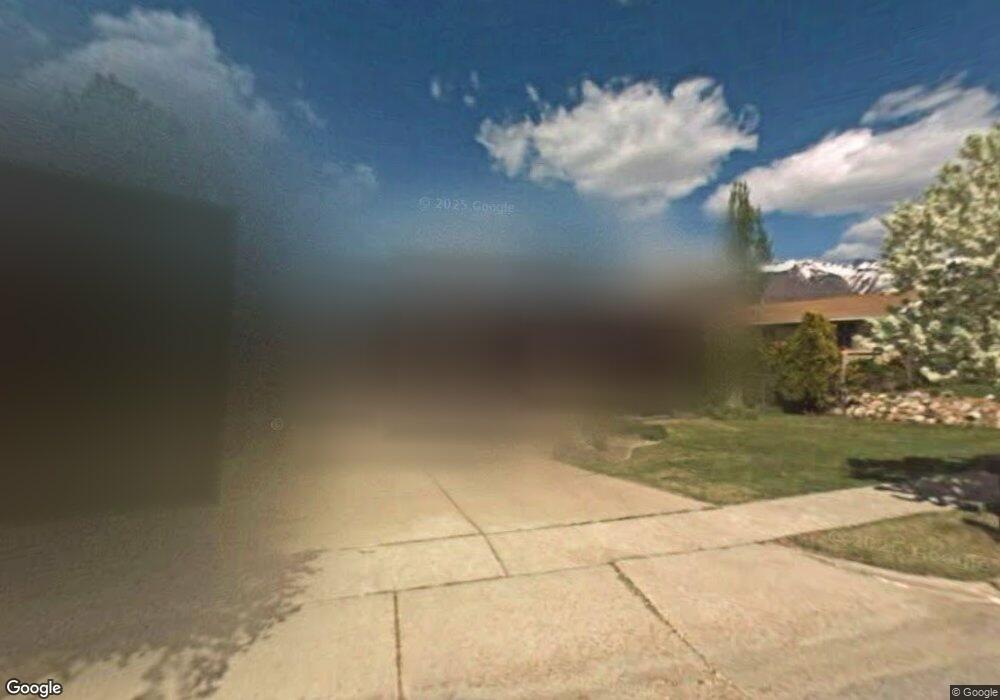
This home is located at 222 W Ridgeline Dr, Ogden, UT 84405 and is currently estimated at $459,533, approximately $227 per square foot. 222 W Ridgeline Dr is a home located in Weber County with nearby schools including Roosevelt School, T.H. Bell Junior High School, and Bonneville High School.
Ownership History
Date
Name
Owned For
Owner Type
Purchase Details
Closed on
Aug 18, 2016
Sold by
Noorda Mark and Noorda Debbie
Bought by
Paredes Charlene
Current Estimated Value
Home Financials for this Owner
Home Financials are based on the most recent Mortgage that was taken out on this home.
Original Mortgage
$196,377
Outstanding Balance
$155,512
Interest Rate
3.25%
Mortgage Type
FHA
Estimated Equity
$304,021
Purchase Details
Closed on
Jan 6, 2005
Sold by
Hud
Bought by
Noorda Mark and Noorda Debbie
Home Financials for this Owner
Home Financials are based on the most recent Mortgage that was taken out on this home.
Original Mortgage
$116,314
Interest Rate
5.7%
Mortgage Type
FHA
Purchase Details
Closed on
Sep 23, 2004
Sold by
Citimortgage Inc
Bought by
Hud
Purchase Details
Closed on
Sep 22, 2004
Sold by
Bingham Harold E and Bingham Donna Gayle
Bought by
Citimortgage Inc
Purchase Details
Closed on
Feb 18, 1999
Sold by
Wall Ricky A
Bought by
Bingham Harold E and Bingham Donna Gayle
Create a Home Valuation Report for This Property
The Home Valuation Report is an in-depth analysis detailing your home's value as well as a comparison with similar homes in the area
Home Values in the Area
Average Home Value in this Area
Purchase History
| Date | Buyer | Sale Price | Title Company |
|---|---|---|---|
| Paredes Charlene | -- | Stewart Title Ins Agency Of | |
| Paredes Charlene | -- | Stewart Title Ins Agency Of | |
| Noorda Mark | -- | Monument Title Insurance Inc | |
| Hud | -- | Backman Stewart Title | |
| Citimortgage Inc | $155,796 | -- | |
| Bingham Harold E | -- | Equity Title |
Source: Public Records
Mortgage History
| Date | Status | Borrower | Loan Amount |
|---|---|---|---|
| Open | Paredes Charlene | $196,377 | |
| Closed | Paredes Charlene | $196,377 | |
| Previous Owner | Noorda Mark | $116,314 | |
| Closed | Noorda Mark | $5,178 |
Source: Public Records
Tax History Compared to Growth
Tax History
| Year | Tax Paid | Tax Assessment Tax Assessment Total Assessment is a certain percentage of the fair market value that is determined by local assessors to be the total taxable value of land and additions on the property. | Land | Improvement |
|---|---|---|---|---|
| 2025 | $2,689 | $448,621 | $134,532 | $314,089 |
| 2024 | $2,689 | $240,899 | $73,992 | $166,907 |
| 2023 | $2,559 | $228,800 | $73,165 | $155,635 |
| 2022 | $2,610 | $239,800 | $70,426 | $169,374 |
| 2021 | $2,025 | $305,000 | $67,480 | $237,520 |
| 2020 | $1,853 | $255,000 | $57,061 | $197,939 |
| 2019 | $1,823 | $235,000 | $51,951 | $183,049 |
| 2018 | $1,634 | $208,000 | $51,951 | $156,049 |
| 2017 | $1,482 | $179,000 | $42,971 | $136,029 |
| 2016 | $1,338 | $89,254 | $21,524 | $67,730 |
| 2015 | $1,310 | $85,925 | $21,524 | $64,401 |
| 2014 | $1,202 | $77,794 | $21,524 | $56,270 |
Source: Public Records
Map
Nearby Homes
- 5465 S 250 W
- 5530 S 100 W
- 376 W 5300 S
- 295 W 5650 S
- 5454 S 150 E Unit 39
- 5226 S 200 W
- 5488 S 250 E
- 283 E 5450 S Unit 20
- 5282 S 575 W
- 405 W 5100 S
- 445 W 5100 S
- 5155 S Ridgeline Dr
- 5420 S 350 E Unit 43
- 390 W 5050 S
- 548 W 5150 S
- 1500 N Spring Creek Ln E
- 246 W 5000 S
- 5033 S 150 E
- 125 W 4900 S Unit 9
- 4931 S 300 W
- 222 W 5500 S
- 208 W Ridgeline Dr
- 236 W Ridgeline Dr
- 5483 S 200 W
- 250 W Ridgeline Dr
- 194 W Ridgeline Dr
- 5466 S 250 W
- 215 W Ridgeline Dr
- 227 W 5500 S
- 227 W Ridgeline Dr
- 5473 S 200 W
- 5476 S 250 W
- 203 W Ridgeline Dr
- 239 W Ridgeline Dr
- 180 W Ridgeline Dr
- 264 W Ridgeline Dr
- 264 W 5500 S
- 191 W Ridgeline Dr
- 5484 S 200 W
- 5570 S 250 W