Estimated Value: $96,378 - $165,000
3
Beds
2
Baths
2,016
Sq Ft
$61/Sq Ft
Est. Value
About This Home
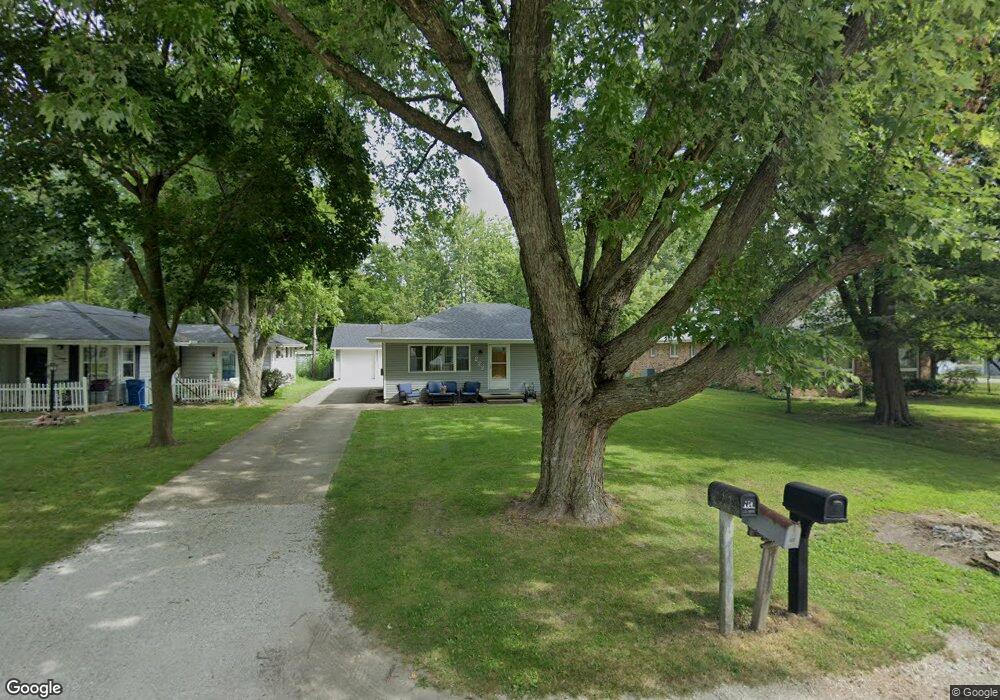
This home is located at 222 W Ruby St, Macon, IL 62544 and is currently estimated at $123,845, approximately $61 per square foot. 222 W Ruby St is a home located in Macon County with nearby schools including Meridian Middle School and Meridian High School.
Ownership History
Date
Name
Owned For
Owner Type
Purchase Details
Closed on
Aug 24, 2020
Sold by
Gant Shelby R
Bought by
Selby Steven L
Current Estimated Value
Home Financials for this Owner
Home Financials are based on the most recent Mortgage that was taken out on this home.
Original Mortgage
$89,444
Outstanding Balance
$79,343
Interest Rate
3%
Mortgage Type
New Conventional
Estimated Equity
$44,502
Purchase Details
Closed on
May 28, 2009
Sold by
Gant Shelby R and Lowe Jonathan D
Bought by
Gant Shelby R
Home Financials for this Owner
Home Financials are based on the most recent Mortgage that was taken out on this home.
Original Mortgage
$64,763
Interest Rate
4.85%
Mortgage Type
FHA
Purchase Details
Closed on
Jan 30, 2006
Sold by
Hilvety Ruth E
Bought by
Gant Shelby R
Home Financials for this Owner
Home Financials are based on the most recent Mortgage that was taken out on this home.
Original Mortgage
$50,400
Interest Rate
6.37%
Mortgage Type
New Conventional
Purchase Details
Closed on
Sep 1, 1989
Create a Home Valuation Report for This Property
The Home Valuation Report is an in-depth analysis detailing your home's value as well as a comparison with similar homes in the area
Purchase History
| Date | Buyer | Sale Price | Title Company |
|---|---|---|---|
| Selby Steven L | $96,000 | None Available | |
| Gant Shelby R | -- | None Available | |
| Gant Shelby R | $63,000 | None Available | |
| -- | $34,000 | -- |
Source: Public Records
Mortgage History
| Date | Status | Borrower | Loan Amount |
|---|---|---|---|
| Open | Selby Steven L | $89,444 | |
| Previous Owner | Gant Shelby R | $64,763 | |
| Previous Owner | Gant Shelby R | $50,400 |
Source: Public Records
Tax History
| Year | Tax Paid | Tax Assessment Tax Assessment Total Assessment is a certain percentage of the fair market value that is determined by local assessors to be the total taxable value of land and additions on the property. | Land | Improvement |
|---|---|---|---|---|
| 2024 | $1,645 | $28,134 | $2,274 | $25,860 |
| 2023 | $1,507 | $25,488 | $2,060 | $23,428 |
| 2022 | $1,464 | $24,346 | $1,968 | $22,378 |
| 2021 | $1,420 | $23,125 | $1,869 | $21,256 |
| 2020 | $1,379 | $21,792 | $1,761 | $20,031 |
| 2019 | $1,379 | $21,792 | $1,761 | $20,031 |
| 2018 | $1,337 | $21,275 | $1,719 | $19,556 |
| 2017 | $1,341 | $21,364 | $1,726 | $19,638 |
| 2016 | $1,380 | $21,338 | $1,724 | $19,614 |
| 2015 | $1,311 | $20,717 | $1,674 | $19,043 |
| 2014 | $1,239 | $20,511 | $1,657 | $18,854 |
| 2013 | $1,263 | $20,511 | $1,657 | $18,854 |
Source: Public Records
Map
Nearby Homes
- 290 W Cole St
- 4982 N Woodcock St
- Lot 13 Galeana Dr
- Lot 52 Galeana Dr
- Lot 12 Galeana Dr
- Lot 51 Galeana Dr
- Lot 50 Galeana Dr
- Lot 8 Galena Dr
- Lot 5 Galena Dr
- Lot 7 Galena Dr
- Lot 6 Galena Dr
- Lot 10 Galena Dr
- Lot 11 Galeana Dr
- Lot 9 Galeana Dr
- Lot 49 Galeana Dr
- Lot 54 Lakelaine Dr
- Lot 56 Lakelaine Dr
- Lot 20 Lakelaine Dr
- Lot 17 Lakelaine Dr
- Lot 15 Lakelaine Dr
Your Personal Tour Guide
Ask me questions while you tour the home.