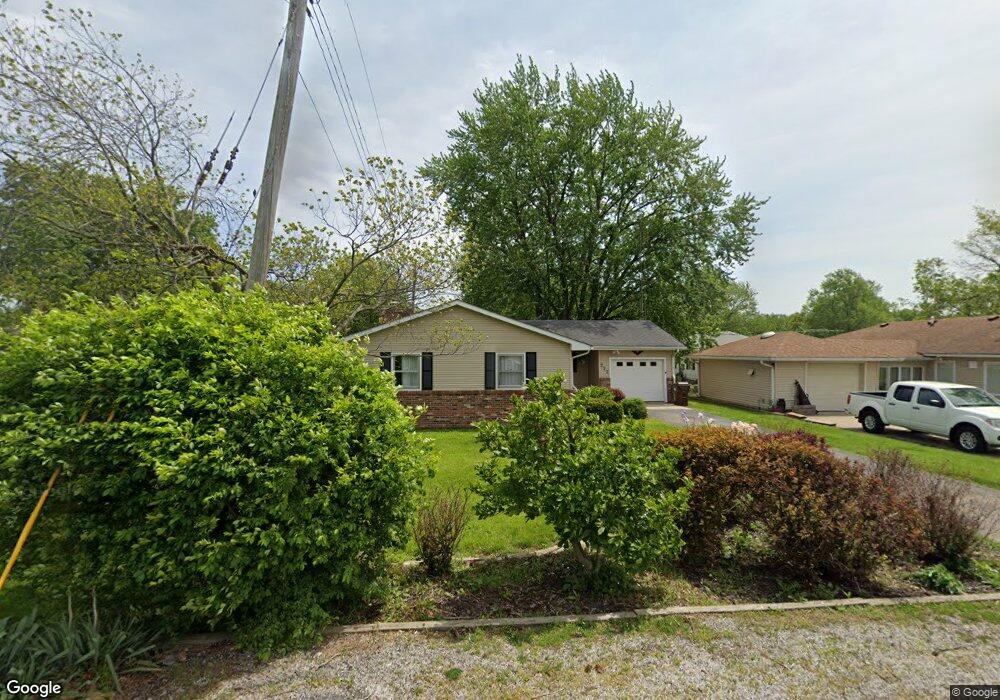
222 Wrightsman St Virden, IL 62690
Estimated Value: $144,605 - $177,000
3
Beds
--
Bath
1,550
Sq Ft
$100/Sq Ft
Est. Value
About This Home
This home is located at 222 Wrightsman St, Virden, IL 62690 and is currently estimated at $154,901, approximately $99 per square foot. 222 Wrightsman St is a home located in Macoupin County with nearby schools including North Mac Elementary School, North Mac Middle School, and North Mac High School.
Ownership History
Date
Name
Owned For
Owner Type
Purchase Details
Closed on
Dec 5, 2025
Sold by
Grundler Adam
Bought by
Hendricks Carley A
Current Estimated Value
Home Financials for this Owner
Home Financials are based on the most recent Mortgage that was taken out on this home.
Original Mortgage
$134,910
Outstanding Balance
$134,910
Interest Rate
5.88%
Mortgage Type
New Conventional
Estimated Equity
$19,991
Purchase Details
Closed on
Nov 3, 2023
Sold by
Grundler Faith
Bought by
Grundler Adam
Purchase Details
Closed on
Nov 20, 2020
Sold by
Close Julie A
Bought by
Grundler Adam and Grundler Faith
Home Financials for this Owner
Home Financials are based on the most recent Mortgage that was taken out on this home.
Original Mortgage
$84,393
Interest Rate
2.37%
Mortgage Type
New Conventional
Purchase Details
Closed on
Apr 13, 2015
Sold by
Bednara Janell M
Bought by
Close Julie A
Home Financials for this Owner
Home Financials are based on the most recent Mortgage that was taken out on this home.
Original Mortgage
$81,600
Interest Rate
2.75%
Mortgage Type
New Conventional
Purchase Details
Closed on
Mar 19, 1991
Bought by
Hays Adele M
Create a Home Valuation Report for This Property
The Home Valuation Report is an in-depth analysis detailing your home's value as well as a comparison with similar homes in the area
Home Values in the Area
Average Home Value in this Area
Purchase History
| Date | Buyer | Sale Price | Title Company |
|---|---|---|---|
| Hendricks Carley A | -- | None Listed On Document | |
| Grundler Adam | -- | None Listed On Document | |
| Grundler Adam | $85,000 | None Available | |
| Close Julie A | $96,000 | Quad County & Abstract | |
| Hays Adele M | $55,500 | -- |
Source: Public Records
Mortgage History
| Date | Status | Borrower | Loan Amount |
|---|---|---|---|
| Open | Hendricks Carley A | $134,910 | |
| Previous Owner | Grundler Adam | $84,393 | |
| Previous Owner | Close Julie A | $81,600 |
Source: Public Records
Tax History
| Year | Tax Paid | Tax Assessment Tax Assessment Total Assessment is a certain percentage of the fair market value that is determined by local assessors to be the total taxable value of land and additions on the property. | Land | Improvement |
|---|---|---|---|---|
| 2024 | $3,109 | $37,552 | $1,569 | $35,983 |
| 2023 | $2,966 | $34,771 | $1,453 | $33,318 |
| 2022 | $2,966 | $32,496 | $1,358 | $31,138 |
| 2021 | $2,752 | $30,370 | $1,269 | $29,101 |
| 2020 | $2,657 | $29,774 | $1,244 | $28,530 |
| 2019 | $2,860 | $32,343 | $1,244 | $31,099 |
| 2018 | $2,830 | $31,865 | $1,226 | $30,639 |
| 2017 | $2,525 | $30,937 | $1,190 | $29,747 |
| 2016 | $2,653 | $29,247 | $1,125 | $28,122 |
| 2015 | $2,543 | $29,247 | $1,125 | $28,122 |
| 2014 | $2,503 | $29,247 | $1,125 | $28,122 |
| 2013 | $1,545 | $29,247 | $1,125 | $28,122 |
Source: Public Records
Map
Nearby Homes
- 209 S Finis St
- 110 S Blair St
- 323 N Dye St
- 333 N Dye St
- 231 E Stoddard Ave
- 18880 Perry Dr
- 145 Illini Trail
- 518 N 2nd St
- 218 E Jefferson St
- 204 E Madison St
- 205 S 7th St
- 207 Brenda Ln
- 403 S 4th St
- L7 4th St
- 419 S 5th St
- 35623 Davis Rd
- 16015 Briarwood Trace
- 15959 N Lake Rd
- 15871 N Lake Rd
- 14201 Williamson Rd
- 545 W Holden St
- 550 W Green St
- 540 W Green St
- 539 W Holden St
- 536 W Green St
- 535 W Holden St
- 530 W Green St
- 540 W Holden St
- 302 Wrightsman St
- 302 Wrightsman St
- 221 Wrightsman St
- 528 W Holden St
- 528 W Green St
- 539 W Green St
- 531 W Green St
- 526 W Holden St
- 225 S Hobson St
- 306 Wrightsman St
- 306 Wrightsman St
- 524 W Green St
Your Personal Tour Guide
Ask me questions while you tour the home.