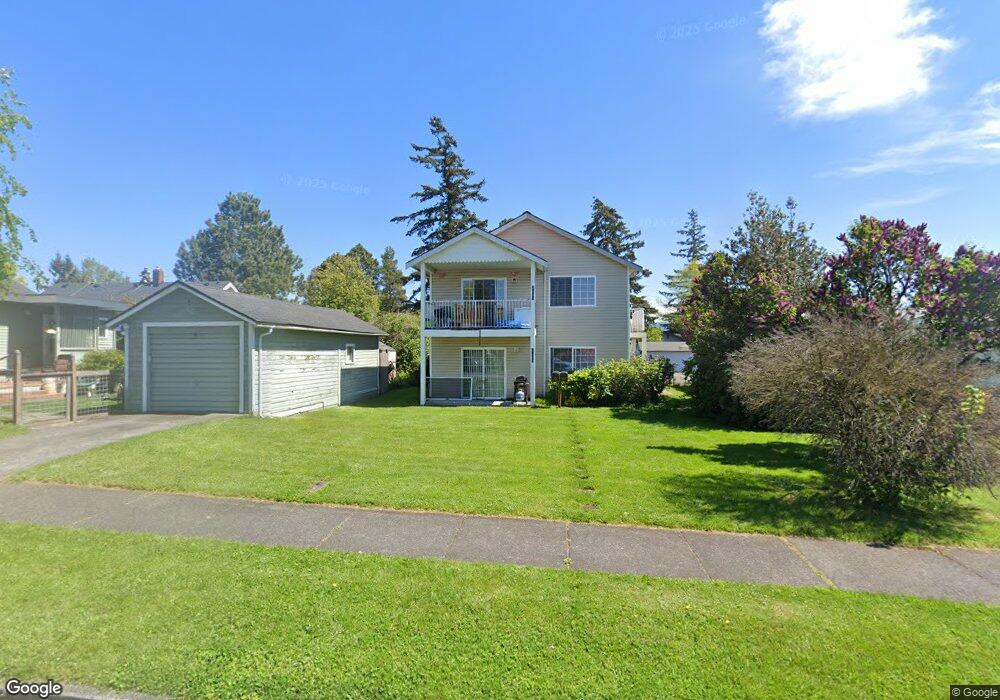
2220 - 2222 Dean Ave Bellingham, WA 98225
Sunnyland NeighborhoodEstimated Value: $726,829 - $829,000
3
Beds
2
Baths
1,092
Sq Ft
$728/Sq Ft
Est. Value
About This Home
This home is located at 2220 - 2222 Dean Ave, Bellingham, WA 98225 and is currently estimated at $795,207, approximately $728 per square foot. 2220 - 2222 Dean Ave is a home located in Whatcom County with nearby schools including Parkview Elementary School, Whatcom Middle School, and Bellingham High School.
Ownership History
Date
Name
Owned For
Owner Type
Purchase Details
Closed on
Feb 3, 2021
Sold by
Schur Anne
Bought by
Denu Llc
Current Estimated Value
Purchase Details
Closed on
Jul 20, 1999
Sold by
Ware William N
Bought by
Schur Anne
Home Financials for this Owner
Home Financials are based on the most recent Mortgage that was taken out on this home.
Original Mortgage
$132,900
Interest Rate
7.51%
Purchase Details
Closed on
Feb 16, 1999
Sold by
Bartleson John E and Bartleson Lori L
Bought by
Ware William
Home Financials for this Owner
Home Financials are based on the most recent Mortgage that was taken out on this home.
Original Mortgage
$138,700
Interest Rate
6.78%
Create a Home Valuation Report for This Property
The Home Valuation Report is an in-depth analysis detailing your home's value as well as a comparison with similar homes in the area
Home Values in the Area
Average Home Value in this Area
Purchase History
| Date | Buyer | Sale Price | Title Company |
|---|---|---|---|
| Denu Llc | -- | None Available | |
| Schur Anne | $189,900 | Whatcom Land Title | |
| Ware William | $41,000 | Whatcom Land Title Company I |
Source: Public Records
Mortgage History
| Date | Status | Borrower | Loan Amount |
|---|---|---|---|
| Previous Owner | Schur Anne | $132,900 | |
| Previous Owner | Ware William | $138,700 |
Source: Public Records
Tax History Compared to Growth
Tax History
| Year | Tax Paid | Tax Assessment Tax Assessment Total Assessment is a certain percentage of the fair market value that is determined by local assessors to be the total taxable value of land and additions on the property. | Land | Improvement |
|---|---|---|---|---|
| 2024 | $5,533 | $693,364 | $277,092 | $416,272 |
| 2023 | $5,533 | $710,975 | $284,130 | $426,845 |
| 2022 | $4,518 | $612,921 | $244,944 | $367,977 |
| 2021 | $4,433 | $486,445 | $194,400 | $292,045 |
| 2020 | $4,534 | $450,412 | $180,000 | $270,412 |
| 2019 | $4,060 | $445,329 | $158,052 | $287,277 |
| 2018 | $4,088 | $399,742 | $141,902 | $257,840 |
| 2017 | $3,527 | $344,165 | $122,170 | $221,995 |
| 2016 | $3,086 | $310,326 | $109,630 | $200,696 |
| 2015 | $3,026 | $282,644 | $100,130 | $182,514 |
| 2014 | -- | $268,163 | $95,000 | $173,163 |
| 2013 | -- | $258,493 | $84,000 | $174,493 |
Source: Public Records
Map
Nearby Homes
- 2111 Franklin St
- 2019 Cornwall Ave
- 2500 Cornwall Ave
- 2432 Grant St
- 1724 Iron St
- 1800 J St
- 2500 Meridian St
- 2312 Orleans St
- 5 XX Gladstone St
- 1410 J St
- 2935 King St
- 1200 W Holly St
- 2600 Elm St
- 1315 Astor St
- 1025 Granary Ave Unit 503
- 1025 Granary Ave Unit 404
- 1025 Granary Ave Unit 306
- 1025 Granary Ave Unit 506
- 1025 Granary Ave Unit 501-A
- 1025 Granary Ave Unit 307-B