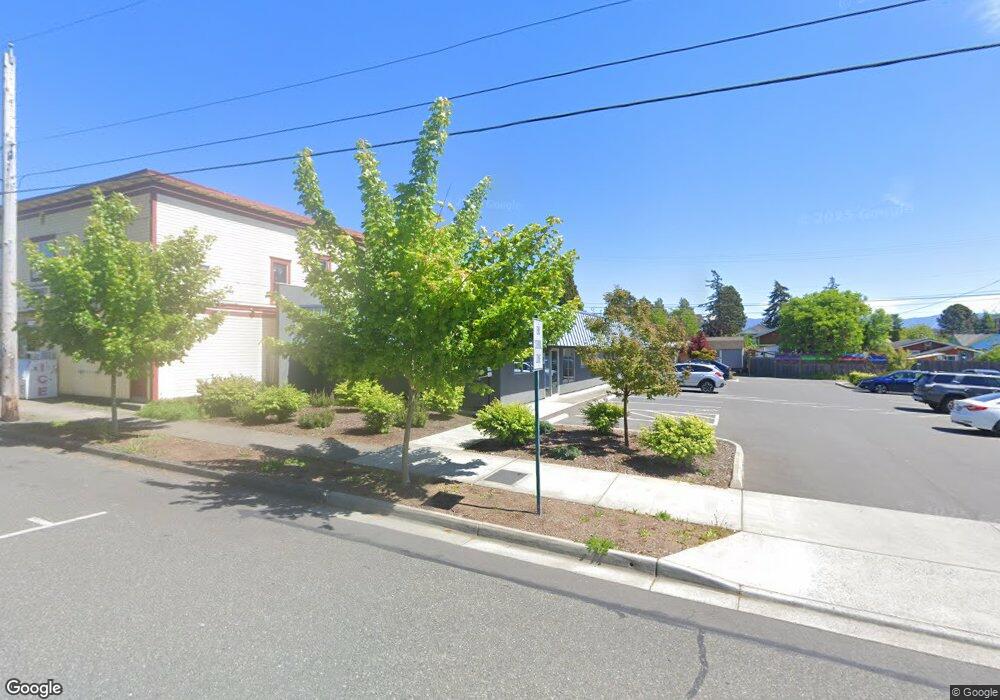
2220 Cornwall Ave Bellingham, WA 98225
Sunnyland NeighborhoodEstimated Value: $1,059,532
--
Bed
--
Bath
6,261
Sq Ft
$169/Sq Ft
Est. Value
About This Home
This home is located at 2220 Cornwall Ave, Bellingham, WA 98225 and is currently priced at $1,059,532, approximately $169 per square foot. 2220 Cornwall Ave is a home located in Whatcom County with nearby schools including Parkview Elementary School, Whatcom Middle School, and Bellingham High School.
Ownership History
Date
Name
Owned For
Owner Type
Purchase Details
Closed on
Apr 12, 2016
Sold by
Bunks Medical Group Llc
Bought by
2220 Cornwall Llc
Current Estimated Value
Home Financials for this Owner
Home Financials are based on the most recent Mortgage that was taken out on this home.
Original Mortgage
$408,000
Outstanding Balance
$324,662
Interest Rate
3.73%
Mortgage Type
Seller Take Back
Purchase Details
Closed on
Jun 4, 2009
Sold by
Weaver John H and Weaver Sue
Bought by
Bunks Medical Group Llc
Create a Home Valuation Report for This Property
The Home Valuation Report is an in-depth analysis detailing your home's value as well as a comparison with similar homes in the area
Home Values in the Area
Average Home Value in this Area
Purchase History
| Date | Buyer | Sale Price | Title Company |
|---|---|---|---|
| 2220 Cornwall Llc | $510,000 | Whatcom Land Title | |
| Bunks Medical Group Llc | -- | None Available |
Source: Public Records
Mortgage History
| Date | Status | Borrower | Loan Amount |
|---|---|---|---|
| Open | 2220 Cornwall Llc | $408,000 |
Source: Public Records
Tax History Compared to Growth
Tax History
| Year | Tax Paid | Tax Assessment Tax Assessment Total Assessment is a certain percentage of the fair market value that is determined by local assessors to be the total taxable value of land and additions on the property. | Land | Improvement |
|---|---|---|---|---|
| 2024 | $3,426 | $439,970 | $270,525 | $169,445 |
| 2023 | $3,426 | $439,970 | $270,525 | $169,445 |
| 2022 | $5,532 | $1,416,759 | $517,275 | $899,484 |
| 2021 | $5,862 | $595,615 | $453,750 | $141,865 |
| 2020 | $5,564 | $595,615 | $453,750 | $141,865 |
| 2019 | $5,155 | $546,452 | $370,920 | $175,532 |
| 2018 | $5,944 | $507,558 | $344,520 | $163,038 |
| 2017 | $5,782 | $500,460 | $339,702 | $160,758 |
| 2016 | $6,192 | $508,718 | $339,702 | $169,016 |
| 2015 | $6,217 | $567,199 | $339,702 | $227,497 |
| 2014 | -- | $551,000 | $330,000 | $221,000 |
| 2013 | -- | $539,980 | $323,400 | $216,580 |
Source: Public Records
Map
Nearby Homes