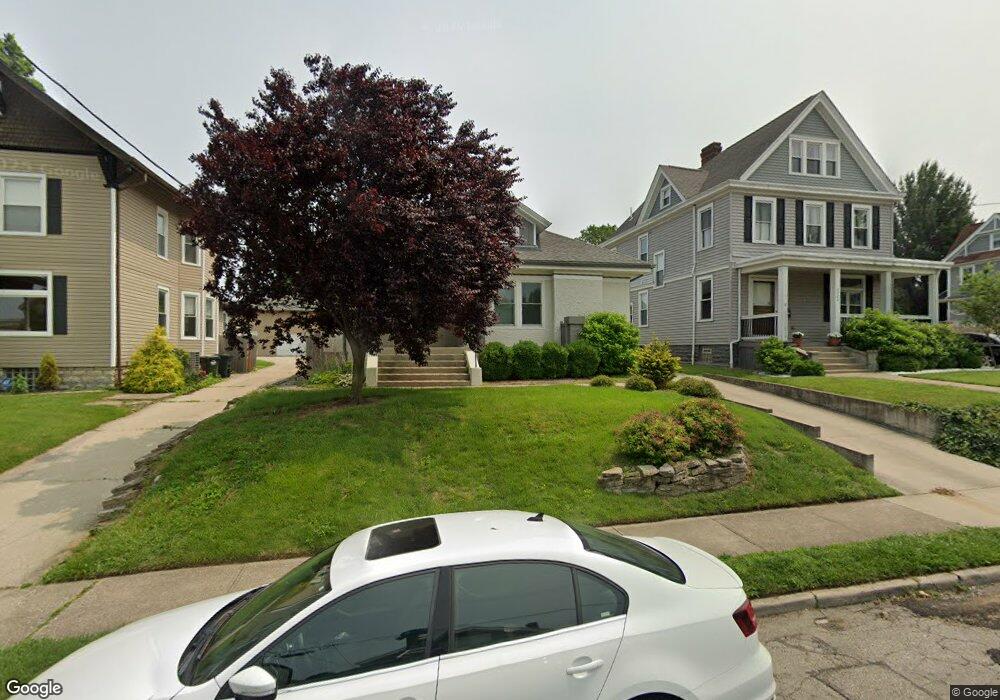
2220 Monroe Ave Cincinnati, OH 45212
Estimated Value: $354,978 - $436,000
3
Beds
2
Baths
2,093
Sq Ft
$188/Sq Ft
Est. Value
About This Home
This home is located at 2220 Monroe Ave, Cincinnati, OH 45212 and is currently estimated at $393,245, approximately $187 per square foot. 2220 Monroe Ave is a home located in Hamilton County with nearby schools including Norwood High School, Cornerstone Christian Academy, and Immaculate Conception Academy.
Ownership History
Date
Name
Owned For
Owner Type
Purchase Details
Closed on
Jun 29, 2016
Sold by
Sternber Jeremy A and Sternber Adrienne M
Bought by
Jesse Adam D
Current Estimated Value
Home Financials for this Owner
Home Financials are based on the most recent Mortgage that was taken out on this home.
Original Mortgage
$168,000
Outstanding Balance
$132,927
Interest Rate
3.64%
Mortgage Type
New Conventional
Estimated Equity
$260,318
Purchase Details
Closed on
Oct 30, 2007
Sold by
Bradley William J and Bradley Margaret
Bought by
Sternberg Jeremy A and Sternberg Adrienne M
Home Financials for this Owner
Home Financials are based on the most recent Mortgage that was taken out on this home.
Original Mortgage
$190,741
Interest Rate
6.44%
Mortgage Type
FHA
Purchase Details
Closed on
Nov 3, 2006
Sold by
Frost Tony L
Bought by
Bradley William J
Create a Home Valuation Report for This Property
The Home Valuation Report is an in-depth analysis detailing your home's value as well as a comparison with similar homes in the area
Home Values in the Area
Average Home Value in this Area
Purchase History
We collect this data history from publicly available records. To have your information removed, we recommend requesting removal directly through your county’s website.
| Date | Buyer | Sale Price | Title Company |
|---|---|---|---|
| Jesse Adam D | $210,000 | -- | |
| Sternberg Jeremy A | $193,500 | Prominent Title Agency Llc | |
| Bradley William J | $125,000 | Attorney |
Source: Public Records
Mortgage History
We collect this data history from publicly available records. To have your information removed, we recommend requesting removal directly through your county’s website.
| Date | Status | Borrower | Loan Amount |
|---|---|---|---|
| Open | Jesse Adam D | $168,000 | |
| Previous Owner | Sternberg Jeremy A | $190,741 |
Source: Public Records
Tax History
| Year | Tax Paid | Tax Assessment Tax Assessment Total Assessment is a certain percentage of the fair market value that is determined by local assessors to be the total taxable value of land and additions on the property. | Land | Improvement |
|---|---|---|---|---|
| 2025 | $4,640 | $87,144 | $29,383 | $57,761 |
| 2024 | $4,642 | $87,144 | $29,383 | $57,761 |
| 2023 | $4,506 | $87,144 | $29,383 | $57,761 |
| 2022 | $5,151 | $83,790 | $13,321 | $70,469 |
| 2021 | $5,016 | $83,790 | $13,321 | $70,469 |
| 2020 | $5,025 | $83,790 | $13,321 | $70,469 |
| 2019 | $4,765 | $73,501 | $11,687 | $61,814 |
| 2018 | $4,771 | $73,501 | $11,687 | $61,814 |
| 2017 | $4,499 | $73,501 | $11,687 | $61,814 |
| 2016 | $3,207 | $50,355 | $11,687 | $38,668 |
| 2015 | $2,855 | $50,355 | $11,687 | $38,668 |
| 2014 | $2,848 | $50,355 | $11,687 | $38,668 |
| 2013 | $2,818 | $50,355 | $11,687 | $38,668 |
Source: Public Records
Map
Nearby Homes
- 4235 Floral Ave
- 4206 Lafayette Ave
- 4019 Elsmere Ave
- 2315 Adams Ave
- 4162 Forest Ave
- 3956 Hazel Ave
- 4110 Wood St
- 4108 Wood St
- 3950 Elsmere Ave
- 4026 Burwood Ave
- 1927 Hopkins Ave
- 3951 Spencer Ave
- 4422 Franklin Ave
- 4019 S Madison Ave
- 1846 Lincoln Ave
- 4010 S Madison Ave
- 4030 S Jefferson Ave
- 2072 Elm Ave
- 1829 Lincoln Ave
- 3919 Burwood Ave
- 2224 Monroe Ave
- 2216 Monroe Ave
- 2214 Monroe Ave
- 4301 Ashland Ave
- 2223 Madison Ave
- 4311 Ashland Ave
- 2227 Madison Ave
- 2219 Madison Ave
- 4305 Ashland Ave
- 2219 Monroe Ave
- 2221 Monroe Ave
- 2215 Madison Ave
- 4406 Lafayette Ave
- 4410 Lafayette Ave
- 4317 Ashland Ave
- 4412 Lafayette Ave
- 2215 Monroe Ave
- 4321 Ashland Ave
- 2211 Monroe Ave
- 4416 Lafayette Ave
Your Personal Tour Guide
Ask me questions while you tour the home.