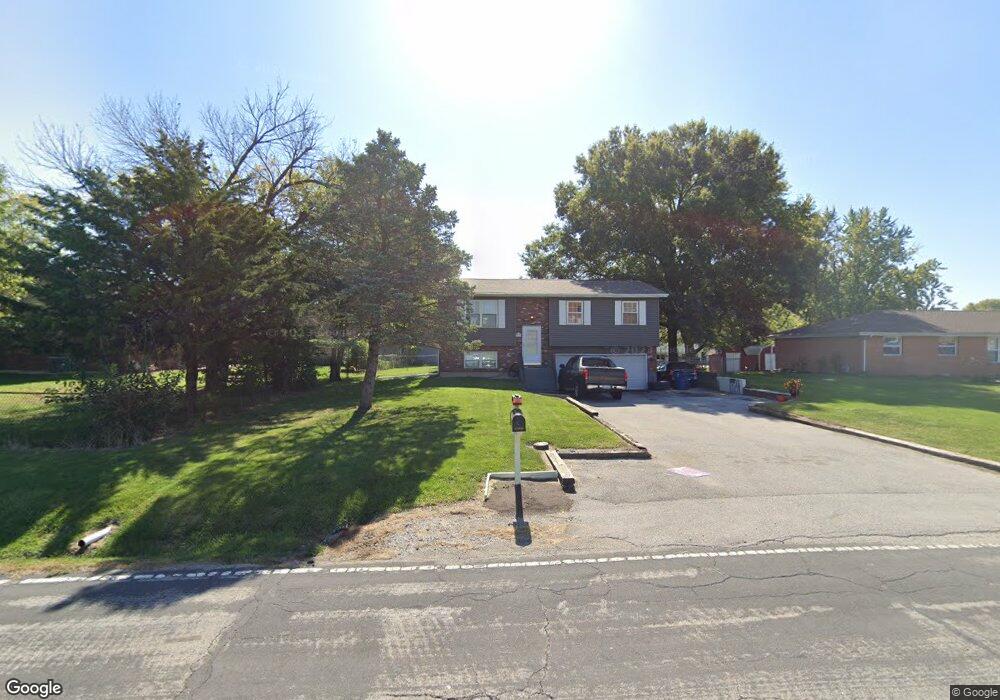
2220 Vadalabene Dr Maryville, IL 62062
Estimated Value: $200,000 - $229,000
4
Beds
2
Baths
1,100
Sq Ft
$199/Sq Ft
Est. Value
About This Home
This home is located at 2220 Vadalabene Dr, Maryville, IL 62062 and is currently estimated at $218,587, approximately $198 per square foot. 2220 Vadalabene Dr is a home located in Madison County with nearby schools including Maryville Elementary School, Dorris Intermediate School, and Collinsville Middle School.
Ownership History
Date
Name
Owned For
Owner Type
Purchase Details
Closed on
Jun 1, 2023
Sold by
Kennedy Rhonda C
Bought by
Kennedy Trust
Current Estimated Value
Purchase Details
Closed on
Feb 2, 2019
Sold by
Mcgee Timothy M
Bought by
Mcgee Rhonda C
Purchase Details
Closed on
Apr 12, 2007
Sold by
Chopiwskyj Eugene Lev
Bought by
Chopiwskyj Rhonda C
Purchase Details
Closed on
Dec 22, 2004
Sold by
Chopiwskyj Eugene L
Bought by
Chopiwskyj Rhonda C
Purchase Details
Closed on
Jan 27, 2003
Sold by
Hunsinger Christopher J
Bought by
Hunsinger Rhonda C
Home Financials for this Owner
Home Financials are based on the most recent Mortgage that was taken out on this home.
Original Mortgage
$96,300
Interest Rate
6.06%
Mortgage Type
Purchase Money Mortgage
Create a Home Valuation Report for This Property
The Home Valuation Report is an in-depth analysis detailing your home's value as well as a comparison with similar homes in the area
Home Values in the Area
Average Home Value in this Area
Purchase History
| Date | Buyer | Sale Price | Title Company |
|---|---|---|---|
| Kennedy Trust | -- | None Available | |
| Mcgee Rhonda C | -- | None Available | |
| Chopiwskyj Rhonda C | -- | None Available | |
| Chopiwskyj Rhonda C | -- | Abstracts & Titles Inc | |
| Chopiwskyj Rhonda C | -- | Abstracts & Titles Inc | |
| Hunsinger Rhonda C | -- | Fatic |
Source: Public Records
Mortgage History
| Date | Status | Borrower | Loan Amount |
|---|---|---|---|
| Previous Owner | Hunsinger Rhonda C | $96,300 |
Source: Public Records
Tax History Compared to Growth
Tax History
| Year | Tax Paid | Tax Assessment Tax Assessment Total Assessment is a certain percentage of the fair market value that is determined by local assessors to be the total taxable value of land and additions on the property. | Land | Improvement |
|---|---|---|---|---|
| 2024 | $2,937 | $49,820 | $4,570 | $45,250 |
| 2023 | $2,937 | $45,710 | $4,160 | $41,550 |
| 2022 | $2,728 | $42,270 | $3,850 | $38,420 |
| 2021 | $2,428 | $39,720 | $3,620 | $36,100 |
| 2020 | $2,325 | $37,890 | $3,450 | $34,440 |
| 2019 | $2,255 | $36,690 | $5,650 | $31,040 |
| 2018 | $2,190 | $34,760 | $5,350 | $29,410 |
| 2017 | $2,174 | $34,060 | $5,240 | $28,820 |
| 2016 | $2,273 | $34,060 | $5,240 | $28,820 |
| 2015 | $2,263 | $33,170 | $5,100 | $28,070 |
| 2014 | $2,263 | $33,170 | $5,100 | $28,070 |
| 2013 | $2,263 | $33,170 | $5,100 | $28,070 |
Source: Public Records
Map
Nearby Homes
- 1 Heather Green
- 2301 Preswyck Ct
- 2009 Buttonwood Ct
- 6817 Bouse Rd
- 10 Dunbridge Ct
- 77 Kingsley Way
- 1844 Crimson Oak Dr
- 1831 Crimson Oak Dr
- 419 N Donk Ave
- 1830 Robin Mills Ct
- 1819 Robin Mills Ct
- 1826 Robin Mills Ct
- 1 Pioneer Trail
- 24 Alta St
- 1815 Robins Mill Ct
- 0 Homes of Liberty Place
- 17 Waterford Ln
- 4519 Bruin Ln
- 201 S Lange Ave
- 137 W Zupan St
- 15 Wexford Green
- 16 Wexford Green
- 2216 Vadalabene Dr
- 5 Heather Green
- 17 Wexford Green
- 2214 Vadalabene Dr
- 2 Heather Green
- 18 Wexford Green
- 13 Heather Green
- 31 Wexford Green
- 19 Wexford Green
- 32 Wexford Green
- 2228 Vadalabene Dr
- 30 Wexford Green
- 2206 Vadalabene Dr
- 29 Wexford Green
- 33 Wexford Green
- 34 Wexford Green
- 38 Camrose Green
- 28 Wexford Green