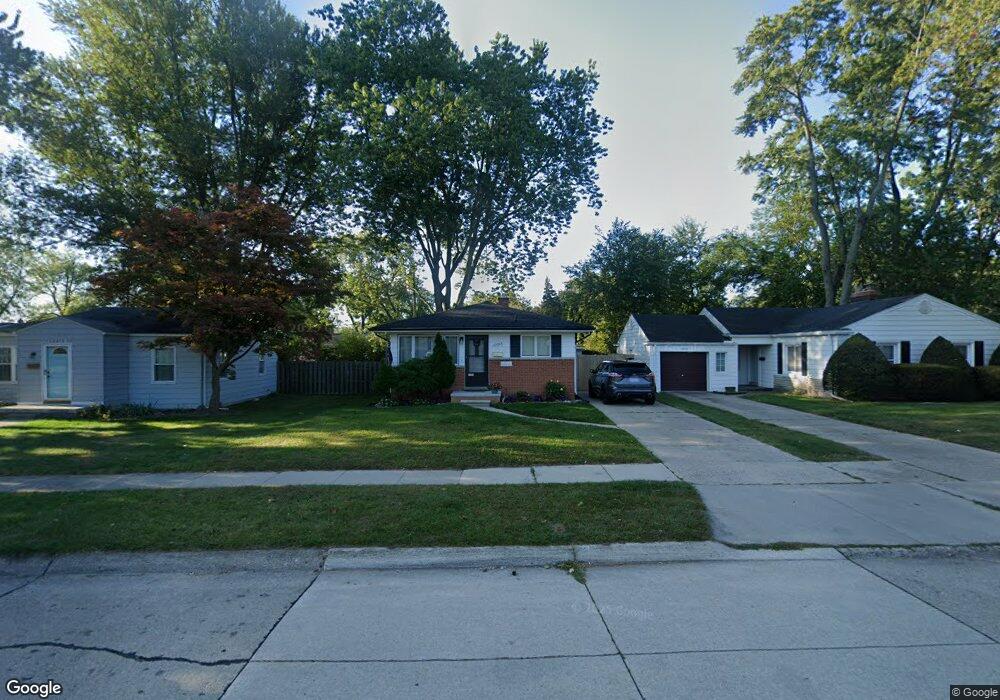
22206 Cedar St Unit Bldg-Unit Saint Clair Shores, MI 48081
Estimated Value: $219,000 - $234,000
3
Beds
2
Baths
969
Sq Ft
$232/Sq Ft
Est. Value
About This Home
This home is located at 22206 Cedar St Unit Bldg-Unit, Saint Clair Shores, MI 48081 and is currently estimated at $224,962, approximately $232 per square foot. 22206 Cedar St Unit Bldg-Unit is a home located in Macomb County with nearby schools including Lakeview High School and St. Germaine Catholic School.
Ownership History
Date
Name
Owned For
Owner Type
Purchase Details
Closed on
Mar 28, 2022
Sold by
Boswell Derek John
Bought by
Boswell Derek John and Ridge Chelsea
Current Estimated Value
Purchase Details
Closed on
Mar 25, 2022
Sold by
Victor Murillo
Bought by
Boswell Derek John
Purchase Details
Closed on
Mar 27, 2018
Sold by
Scs Cedar Properties
Bought by
Murillo Victor and Zumarraga Lura Sandra
Purchase Details
Closed on
Jun 18, 2010
Sold by
Mancini Anthony
Bought by
Scs Cedar Properties Llc
Purchase Details
Closed on
Nov 7, 2008
Sold by
Tauchus Candace
Bought by
Lasalle Bank National Association
Purchase Details
Closed on
May 11, 2007
Sold by
Williams Robert A and Williams Judith A
Bought by
Tauchus Candace
Purchase Details
Closed on
Nov 18, 2005
Sold by
Japowicz Milton S and Japowicz Marcia M
Bought by
Williams Robert A
Create a Home Valuation Report for This Property
The Home Valuation Report is an in-depth analysis detailing your home's value as well as a comparison with similar homes in the area
Home Values in the Area
Average Home Value in this Area
Purchase History
| Date | Buyer | Sale Price | Title Company |
|---|---|---|---|
| Boswell Derek John | -- | Premier Title | |
| Boswell Derek John | $178,500 | None Listed On Document | |
| Boswell Derek John | $178,500 | None Listed On Document | |
| Murillo Victor | $125,000 | None Available | |
| Scs Cedar Properties Llc | -- | None Available | |
| Lasalle Bank National Association | $90,612 | None Available | |
| Tauchus Candace | $117,500 | Greco | |
| Williams Robert A | $75,000 | -- |
Source: Public Records
Tax History Compared to Growth
Tax History
| Year | Tax Paid | Tax Assessment Tax Assessment Total Assessment is a certain percentage of the fair market value that is determined by local assessors to be the total taxable value of land and additions on the property. | Land | Improvement |
|---|---|---|---|---|
| 2025 | $4,189 | $93,900 | $0 | $0 |
| 2024 | $4,057 | $90,100 | $0 | $0 |
| 2023 | $3,956 | $82,500 | $0 | $0 |
| 2022 | $3,024 | $73,000 | $0 | $0 |
| 2021 | $4,048 | $71,400 | $0 | $0 |
| 2020 | $4,042 | $65,700 | $0 | $0 |
| 2019 | $2,337 | $57,500 | $0 | $0 |
| 2018 | $2,570 | $52,900 | $0 | $0 |
| 2017 | $2,570 | $49,500 | $6,000 | $43,500 |
| 2016 | $2,337 | $49,500 | $0 | $0 |
| 2015 | $2,584 | $45,800 | $0 | $0 |
| 2013 | -- | $36,000 | $0 | $0 |
| 2012 | -- | $36,800 | $5,500 | $31,300 |
Source: Public Records
Map
Nearby Homes
- 22202 E 11 Mile Rd Unit 2
- 27728 Florence St
- 27701 Roy St Unit 8
- 21603 Erben St
- 21500 Erben St
- 22301 Ardmore Park Dr
- 22450 Alexander St
- 28004 Roy St
- 22509 Milner St
- 22530 Shorewood Dr
- 22507 Shorewood Dr
- 28112 Florence St
- 27908 Glenwood St
- 22477 Ardmore Park Dr
- 27818 Rosebriar St
- 21400 Centennial St
- 22459 Daniels St
- 22546 Alexander St
- 22731 Gordon Switch St
- 21209 Yale St
- 22206 Cedar St
- 22200 Cedar St
- 22216 Cedar St
- 22030 Cedar St
- 22205 Yale St
- 22224 Cedar St
- 22215 Yale St
- 22201 Cedar St
- 22031 Yale St
- 22205 Cedar St
- 22219 Yale St
- 22215 Cedar St
- 22037 Cedar St
- 22300 Cedar St
- 22301 Yale St
- 22225 Cedar St
- 22024 Cedar St
- 22229 Cedar St
- 22311 Yale St
- 22212 E Eleven Mile Rd