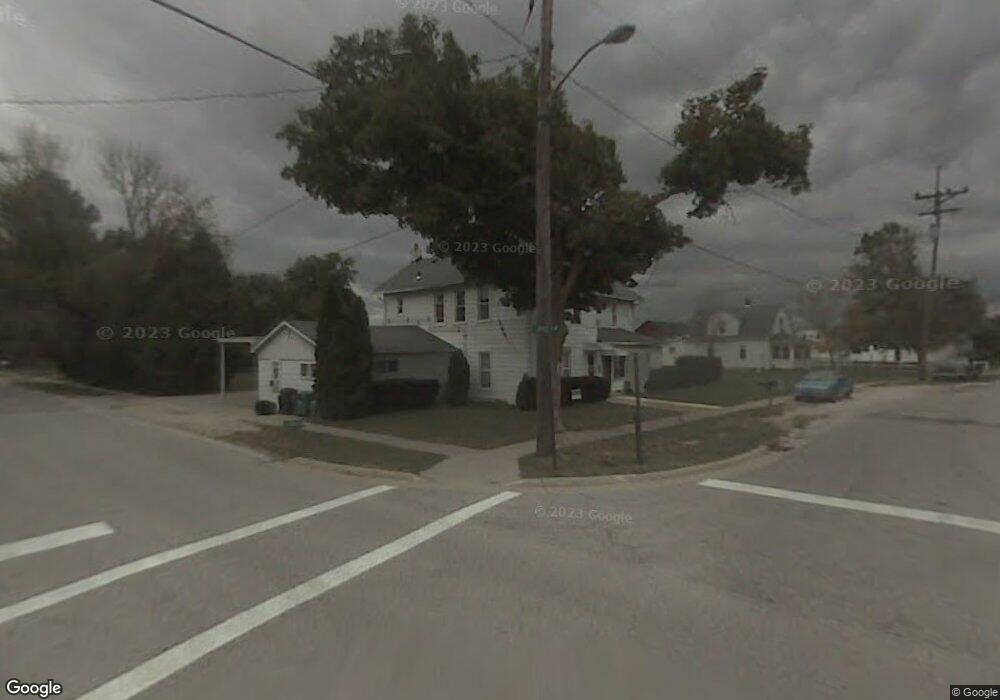
22209 Curtice E & W Curtice, OH 43412
Estimated Value: $296,875 - $379,000
4
Beds
3
Baths
2,326
Sq Ft
$142/Sq Ft
Est. Value
About This Home
This home is located at 22209 Curtice E & W, Curtice, OH 43412 and is currently estimated at $330,219, approximately $141 per square foot. 22209 Curtice E & W is a home located in Ottawa County with nearby schools including Genoa Elementary School.
Ownership History
Date
Name
Owned For
Owner Type
Purchase Details
Closed on
Dec 27, 2016
Sold by
Grzecki Theresa
Bought by
Kincaid Brandon and Kincaid Jamie L
Current Estimated Value
Home Financials for this Owner
Home Financials are based on the most recent Mortgage that was taken out on this home.
Original Mortgage
$176,739
Outstanding Balance
$143,002
Interest Rate
3.5%
Mortgage Type
FHA
Estimated Equity
$187,217
Purchase Details
Closed on
Dec 31, 2009
Sold by
Simko George M and Simko Susan L
Bought by
Grzecki Theresa
Home Financials for this Owner
Home Financials are based on the most recent Mortgage that was taken out on this home.
Original Mortgage
$111,200
Interest Rate
4.84%
Mortgage Type
New Conventional
Purchase Details
Closed on
Oct 15, 1992
Sold by
Kerchevall Edward M and Kerchevall Mary
Bought by
Simko Geo M and Simko Susan L S
Create a Home Valuation Report for This Property
The Home Valuation Report is an in-depth analysis detailing your home's value as well as a comparison with similar homes in the area
Purchase History
| Date | Buyer | Sale Price | Title Company |
|---|---|---|---|
| Kincaid Brandon | $180,000 | Attorney | |
| Grzecki Theresa | $139,000 | Attorney | |
| Simko Geo M | $68,500 | -- |
Source: Public Records
Mortgage History
| Date | Status | Borrower | Loan Amount |
|---|---|---|---|
| Open | Kincaid Brandon | $176,739 | |
| Previous Owner | Grzecki Theresa | $111,200 |
Source: Public Records
Tax History
| Year | Tax Paid | Tax Assessment Tax Assessment Total Assessment is a certain percentage of the fair market value that is determined by local assessors to be the total taxable value of land and additions on the property. | Land | Improvement |
|---|---|---|---|---|
| 2024 | $4,040 | $79,916 | $19,453 | $60,463 |
| 2023 | $3,543 | $59,329 | $9,730 | $49,599 |
| 2022 | $2,981 | $59,329 | $9,730 | $49,599 |
| 2021 | $2,623 | $59,330 | $9,730 | $49,600 |
| 2020 | $2,435 | $52,410 | $6,490 | $45,920 |
| 2019 | $2,414 | $52,410 | $6,490 | $45,920 |
| 2018 | $2,325 | $52,410 | $6,490 | $45,920 |
| 2017 | $2,154 | $44,860 | $6,490 | $38,370 |
| 2016 | $1,056 | $44,860 | $6,490 | $38,370 |
| 2015 | $2,125 | $44,860 | $6,490 | $38,370 |
| 2014 | $908 | $41,590 | $6,490 | $35,100 |
| 2013 | $1,822 | $41,590 | $6,490 | $35,100 |
Source: Public Records
Map
Nearby Homes
- 6927 N Wildacre Rd
- 7105 N Curtice St
- 21224 W Toledo St
- 7330 Jerusalem Rd
- 5531 Brown Rd
- 9015 Seaman Rd
- 155 N Stadium Rd
- 1031 N Cousino Rd
- 330 5th St
- 5914 Kacy Ln
- 5882 Kacy Ln
- 5415 Seaman Rd
- 373 Jude Rd
- 5040 Easton Dr
- 5036 Easton Dr
- 5037 Easton Dr
- 5032 Easton Dr
- 5033 Easton Dr
- 5054 Magnolia Dr
- 5065 Magnolia Dr
- 22209 W Curtice E and W Rd
- 22185 W Curtice E and W Rd
- 22190 W Tall Oaks Cir
- 22204 W Tall Oaks Cir
- 22190 W Curtice Rd
- 22218 W Curtice E and W Rd
- 22190 W Curtice E and W Rd
- 22190 W Curtice E & Rd W
- 22190 Curtice E -W
- 22238 W Curtice E and W Rd
- 7015 N Tall Oaks Dr
- 7030 N Tall Oaks Dr
- 22170 W Tall Oaks Cir
- 22170 W Curtice E and W Rd
- 22257 W Curtice E and W Rd
- 22257 W Curtice Rd
- 7094 N Tall Oaks Cir
- 22148 W Curtice E and W Rd
- 22150 W Tall Oaks Cir
- 22191 W Tall Oaks Cir
Your Personal Tour Guide
Ask me questions while you tour the home.