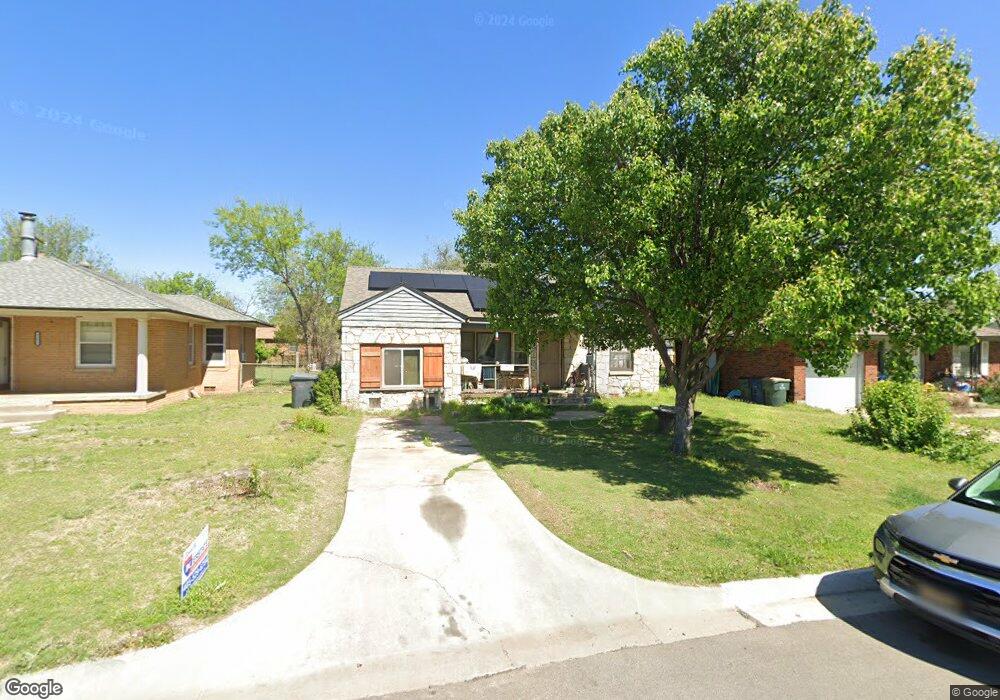
2221 Andover Ct Oklahoma City, OK 73120
Estimated Value: $143,000 - $149,404
2
Beds
1
Bath
738
Sq Ft
$198/Sq Ft
Est. Value
About This Home
This home is located at 2221 Andover Ct, Oklahoma City, OK 73120 and is currently estimated at $145,851, approximately $197 per square foot. 2221 Andover Ct is a home located in Oklahoma County with nearby schools including Ridgeview Elementary School, John Marshall Enterprise Middle School, and John Marshall Enterprise High School.
Ownership History
Date
Name
Owned For
Owner Type
Purchase Details
Closed on
Jan 22, 2004
Sold by
Nickerson Raymond L and Nickerson Mary
Bought by
Kester Beau W and Nickerson Bryanna D
Current Estimated Value
Home Financials for this Owner
Home Financials are based on the most recent Mortgage that was taken out on this home.
Original Mortgage
$52,087
Outstanding Balance
$24,359
Interest Rate
5.9%
Mortgage Type
FHA
Estimated Equity
$121,492
Purchase Details
Closed on
Aug 30, 2000
Sold by
Spire Holdings Llc
Bought by
Nickerson Raymond L and Nickerson Mary
Home Financials for this Owner
Home Financials are based on the most recent Mortgage that was taken out on this home.
Original Mortgage
$46,998
Interest Rate
8.21%
Mortgage Type
Seller Take Back
Purchase Details
Closed on
May 5, 2000
Sold by
Esco Steve and Esco Susan L
Bought by
Spire Holdings Llc
Purchase Details
Closed on
May 14, 1998
Sold by
Esco Steven Joe and Esco Steve
Bought by
Esco Steve and Esco Susan L
Create a Home Valuation Report for This Property
The Home Valuation Report is an in-depth analysis detailing your home's value as well as a comparison with similar homes in the area
Home Values in the Area
Average Home Value in this Area
Purchase History
| Date | Buyer | Sale Price | Title Company |
|---|---|---|---|
| Kester Beau W | $119,166 | Guaranty Title Co | |
| Nickerson Raymond L | $49,000 | -- | |
| Spire Holdings Llc | -- | -- | |
| Esco Steve | -- | -- |
Source: Public Records
Mortgage History
| Date | Status | Borrower | Loan Amount |
|---|---|---|---|
| Open | Kester Beau W | $52,087 | |
| Closed | Nickerson Raymond L | $46,998 |
Source: Public Records
Tax History Compared to Growth
Tax History
| Year | Tax Paid | Tax Assessment Tax Assessment Total Assessment is a certain percentage of the fair market value that is determined by local assessors to be the total taxable value of land and additions on the property. | Land | Improvement |
|---|---|---|---|---|
| 2024 | $1,155 | $10,096 | $2,221 | $7,875 |
| 2023 | $1,155 | $9,615 | $2,227 | $7,388 |
| 2022 | $1,055 | $9,158 | $1,882 | $7,276 |
| 2021 | $976 | $8,722 | $1,926 | $6,796 |
| 2020 | $917 | $8,307 | $2,031 | $6,276 |
| 2019 | $876 | $7,911 | $1,947 | $5,964 |
| 2018 | $792 | $7,535 | $0 | $0 |
| 2017 | $755 | $7,699 | $1,926 | $5,773 |
| 2016 | $727 | $7,369 | $1,926 | $5,443 |
| 2015 | $750 | $7,589 | $1,926 | $5,663 |
| 2014 | $761 | $7,731 | $1,909 | $5,822 |
Source: Public Records
Map
Nearby Homes
- 2244 Churchill Place
- 2826 Guilford Ln
- 2824 Guilford Ln
- 8836 N May Ave Unit 70A
- 2109 Brighton Ave
- 2128 Westchester Dr
- 8900 N May Ave Unit 71A
- 8702 N May Ave Unit 14D
- 2028 Carlisle Rd
- 2008 Andover Ct
- 2020 Hasley Dr
- 2005 Brighton Ave
- 2624 Dorchester Dr
- 1913 Andover Ct
- 1916 Hasley Dr
- 1908 Dorchester Dr
- 2802 W Britton Rd
- 1823 Dorchester Dr
- 9412 Britton Cir
- 1829 Westchester Dr
- 2225 Andover Ct
- 2217 Andover Ct
- 2213 Andover Ct
- 2229 Andover Ct
- 2228 Carlisle Rd
- 2224 Carlisle Rd
- 2232 Carlisle Rd
- 2220 Carlisle Rd
- 2209 Andover Ct
- 2233 Andover Ct
- 2216 Andover Ct
- 2212 Andover Ct
- 2236 Carlisle Rd
- 2216 Carlisle Rd
- 2220 Andover Ct
- 2208 Andover Ct
- 2212 Carlisle Rd
- 2240 Carlisle Rd
- 2224 Andover Ct
- 2205 Andover Ct