Estimated Value: $283,774 - $304,000
3
Beds
1
Bath
1,045
Sq Ft
$281/Sq Ft
Est. Value
About This Home
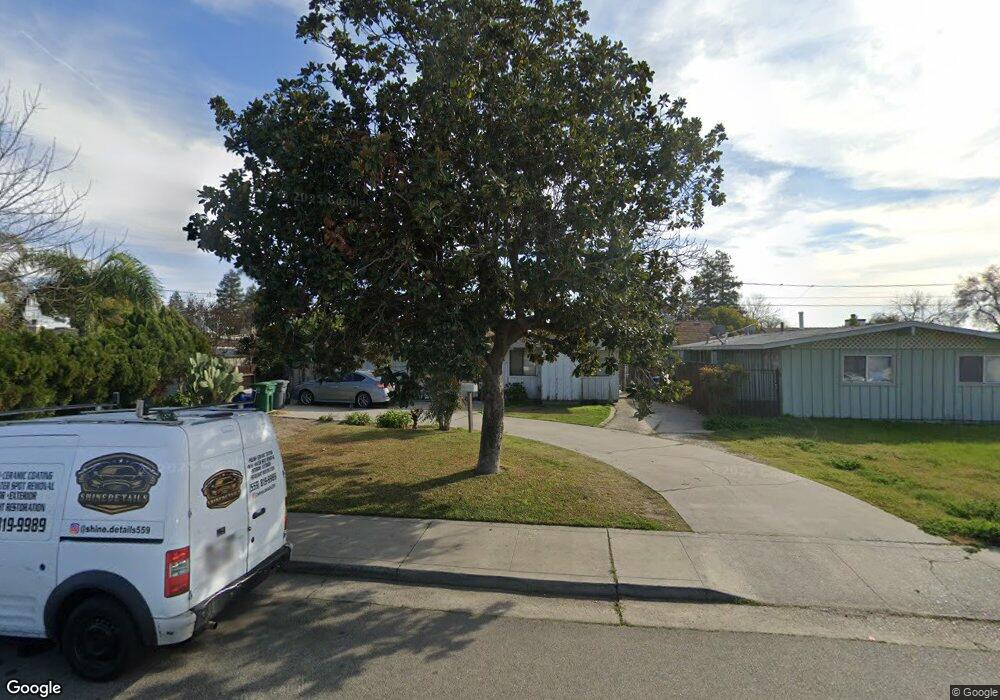
This home is located at 2221 Aspen St, Selma, CA 93662 and is currently estimated at $293,194, approximately $280 per square foot. 2221 Aspen St is a home located in Fresno County with nearby schools including Theodore Roosevelt Elementary School, Abraham Lincoln Middle School, and Selma High School.
Ownership History
Date
Name
Owned For
Owner Type
Purchase Details
Closed on
Aug 26, 1997
Sold by
Ociel Zarate
Bought by
Serapio Amador
Current Estimated Value
Home Financials for this Owner
Home Financials are based on the most recent Mortgage that was taken out on this home.
Original Mortgage
$66,462
Interest Rate
7.49%
Mortgage Type
FHA
Purchase Details
Closed on
Jan 26, 1996
Sold by
Zarate Elias
Bought by
Zarate Ociel and Zarate Elizenda
Create a Home Valuation Report for This Property
The Home Valuation Report is an in-depth analysis detailing your home's value as well as a comparison with similar homes in the area
Home Values in the Area
Average Home Value in this Area
Purchase History
| Date | Buyer | Sale Price | Title Company |
|---|---|---|---|
| Serapio Amador | $66,500 | North American Title Co | |
| Zarate Ociel | -- | Chicago Title Co |
Source: Public Records
Mortgage History
| Date | Status | Borrower | Loan Amount |
|---|---|---|---|
| Previous Owner | Serapio Amador | $66,462 |
Source: Public Records
Tax History
| Year | Tax Paid | Tax Assessment Tax Assessment Total Assessment is a certain percentage of the fair market value that is determined by local assessors to be the total taxable value of land and additions on the property. | Land | Improvement |
|---|---|---|---|---|
| 2025 | $2,265 | $105,354 | $47,884 | $57,470 |
| 2023 | $2,187 | $101,266 | $46,026 | $55,240 |
| 2022 | $2,085 | $99,281 | $45,124 | $54,157 |
| 2021 | $2,031 | $97,336 | $44,240 | $53,096 |
| 2020 | $2,002 | $96,339 | $43,787 | $52,552 |
| 2019 | $1,942 | $94,451 | $42,929 | $51,522 |
| 2018 | $1,894 | $92,600 | $42,088 | $50,512 |
| 2017 | $1,818 | $90,785 | $41,263 | $49,522 |
| 2016 | $1,651 | $89,005 | $40,454 | $48,551 |
| 2015 | $1,671 | $87,669 | $39,847 | $47,822 |
| 2014 | $1,619 | $85,953 | $39,067 | $46,886 |
Source: Public Records
Map
Nearby Homes
- 2222 Barbara St
- 2019 Oak St
- 2020 Aspen St
- 3239 Lee St
- 2221 Floral Ave
- 3280 Mccall Ave
- 2850 Mccall Ave Unit A-F
- 2232 Gaither St
- 12623 S Mccall Ave
- 2002 Merced St
- 2841 C St
- 2210 Northhill St
- 3654 Thompson Ave
- 2607 Nelson Blvd
- 3506 Mulberry St
- 2980 Olive St
- 2226 Arrants St
- 1517 Stillman St
- 1701 Dinuba Ave Unit 40
- 1701 Dinuba Ave Unit 180
Your Personal Tour Guide
Ask me questions while you tour the home.