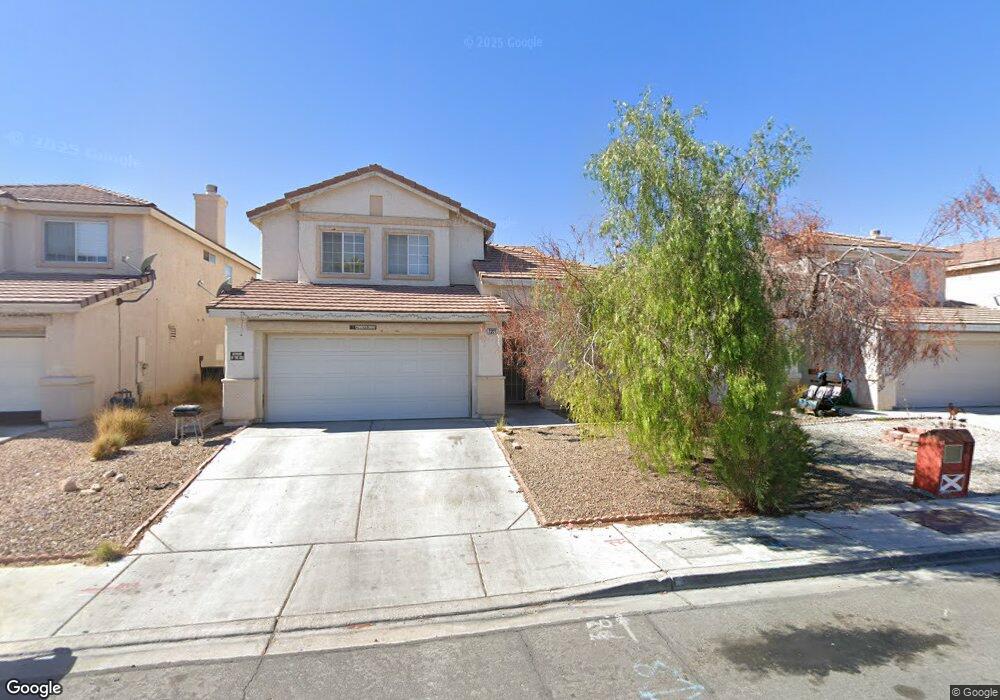
2221 Avery Dr Unit 6 Las Vegas, NV 89108
Michael Way NeighborhoodEstimated Value: $414,681 - $470,000
4
Beds
3
Baths
1,702
Sq Ft
$256/Sq Ft
Est. Value
About This Home
This home is located at 2221 Avery Dr Unit 6, Las Vegas, NV 89108 and is currently estimated at $435,670, approximately $255 per square foot. 2221 Avery Dr Unit 6 is a home located in Clark County with nearby schools including Lilly & Wing Fong Elementary School, J. Harold Brinley Middle School, and Cimarron Memorial High School.
Ownership History
Date
Name
Owned For
Owner Type
Purchase Details
Closed on
Aug 4, 2025
Sold by
Jiang Family Trust and Jiang Bing
Bought by
D I Bing Llc-Series 4
Current Estimated Value
Purchase Details
Closed on
Apr 16, 2016
Sold by
Jiang Bing
Bought by
Jiang Bing and Jiang Family Trust
Purchase Details
Closed on
Nov 14, 2011
Sold by
Bank Of America N A
Bought by
Jiang Bing
Purchase Details
Closed on
Apr 30, 2011
Sold by
Gomez Marilyn B
Bought by
Bac Home Loans Servicing Lp and Countrywide Home Loans Servicing Lp
Purchase Details
Closed on
Aug 7, 2003
Sold by
Gomez Marilyn B
Bought by
Gomez Marilyn B
Home Financials for this Owner
Home Financials are based on the most recent Mortgage that was taken out on this home.
Original Mortgage
$120,000
Interest Rate
5.17%
Mortgage Type
Stand Alone First
Create a Home Valuation Report for This Property
The Home Valuation Report is an in-depth analysis detailing your home's value as well as a comparison with similar homes in the area
Home Values in the Area
Average Home Value in this Area
Purchase History
| Date | Buyer | Sale Price | Title Company |
|---|---|---|---|
| D I Bing Llc-Series 4 | -- | None Listed On Document | |
| Jiang Bing | -- | None Available | |
| Jiang Bing | $80,650 | Fidelity Rainbow | |
| Bac Home Loans Servicing Lp | $90,000 | Lsi Title Agency Inc | |
| Gomez Marilyn B | -- | Ticor Title Of Nevada Inc |
Source: Public Records
Mortgage History
| Date | Status | Borrower | Loan Amount |
|---|---|---|---|
| Previous Owner | Gomez Marilyn B | $120,000 |
Source: Public Records
Tax History Compared to Growth
Tax History
| Year | Tax Paid | Tax Assessment Tax Assessment Total Assessment is a certain percentage of the fair market value that is determined by local assessors to be the total taxable value of land and additions on the property. | Land | Improvement |
|---|---|---|---|---|
| 2025 | $1,953 | $88,016 | $27,300 | $60,716 |
| 2024 | $1,809 | $88,016 | $27,300 | $60,716 |
| 2023 | $1,809 | $86,216 | $28,700 | $57,516 |
| 2022 | $1,675 | $77,209 | $24,500 | $52,709 |
| 2021 | $1,551 | $71,583 | $21,350 | $50,233 |
| 2020 | $1,438 | $69,828 | $19,950 | $49,878 |
| 2019 | $1,347 | $67,053 | $17,850 | $49,203 |
| 2018 | $1,286 | $60,792 | $13,650 | $47,142 |
| 2017 | $1,957 | $59,710 | $11,900 | $47,810 |
| 2016 | $1,218 | $53,858 | $9,800 | $44,058 |
| 2015 | $1,215 | $43,505 | $8,050 | $35,455 |
| 2014 | $1,177 | $35,071 | $4,900 | $30,171 |
Source: Public Records
Map
Nearby Homes
- 2308 Avery Dr
- 6557 Sweetzer Way
- 2201 James Bilbray Dr
- 2136 Bavington Dr Unit A
- 2140 Bavington Dr Unit B
- 2204 Short Pine Dr
- 2248 Short Pine Dr
- 6577 Goldensun Ct
- 2124 Willowbury Dr Unit D
- 2228 Silver Pine Dr Unit 3
- 6465 Big Pine Way
- 2121 Chertsey Dr Unit D
- 2132 Chertsey Dr Unit D
- 2132 Chertsey Dr Unit B
- 2108 Willowbury Dr Unit B
- 2451 N Rainbow Blvd Unit 1019
- 2451 N Rainbow Blvd Unit 2004
- 2451 N Rainbow Blvd Unit 1123
- 2451 N Rainbow Blvd Unit 2073
- 2451 N Rainbow Blvd Unit 1083
- 2217 Avery Dr
- 2217 Avery Dr Unit n/a
- 2225 Avery Dr
- 2229 Avery Dr
- 6576 Woodsworth Ave
- 6572 Woodsworth Ave
- 6580 Woodsworth Ave
- 2220 Steinke Ln
- 2216 Steinke Ln
- 2224 Steinke Ln Unit 2
- 2233 Avery Dr
- 6584 Woodsworth Ave
- 2228 Steinke Ln
- 2237 Avery Dr
- 2232 Steinke Ln
- 6588 Woodsworth Ave
- 6553 Mcrae Ave Unit 101
- 6553 Mcrae Ave Unit 202
- 6553 Mcrae Ave
- 6553 Mcrae Ave Unit 102