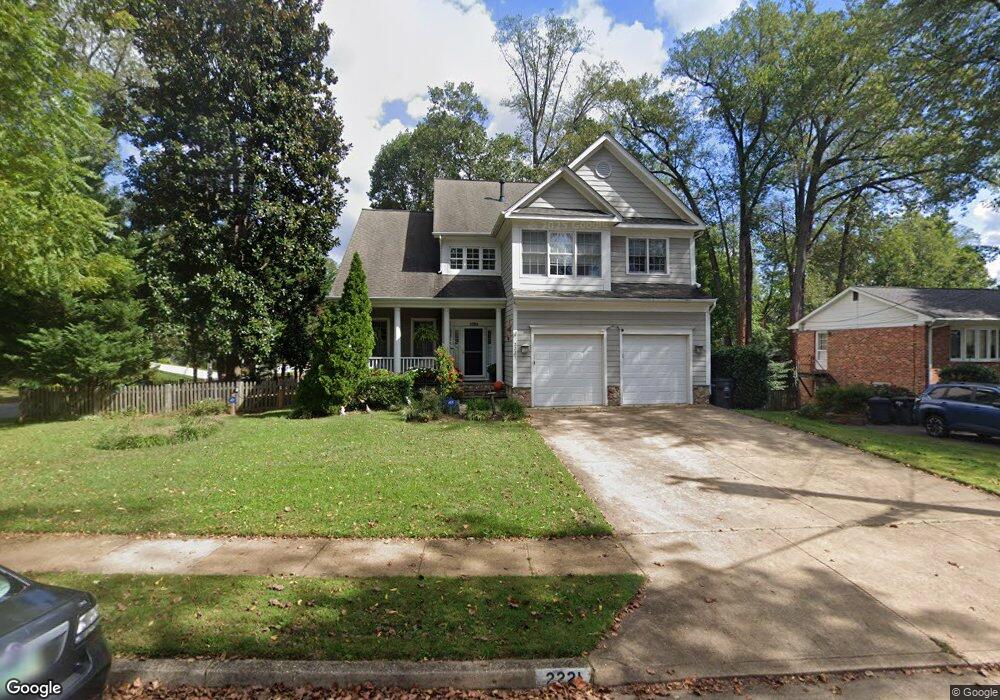
2221 Casemont Dr Falls Church, VA 22046
Estimated Value: $1,440,000 - $1,743,000
5
Beds
5
Baths
2,958
Sq Ft
$543/Sq Ft
Est. Value
About This Home
This home is located at 2221 Casemont Dr, Falls Church, VA 22046 and is currently estimated at $1,605,579, approximately $542 per square foot. 2221 Casemont Dr is a home located in Fairfax County with nearby schools including Haycock Elementary School, Longfellow Middle School, and St. James Catholic School.
Ownership History
Date
Name
Owned For
Owner Type
Purchase Details
Closed on
Feb 28, 2006
Sold by
Laporte Christopher R
Bought by
Tierney Carl J
Current Estimated Value
Home Financials for this Owner
Home Financials are based on the most recent Mortgage that was taken out on this home.
Original Mortgage
$783,000
Outstanding Balance
$442,258
Interest Rate
6.16%
Mortgage Type
New Conventional
Estimated Equity
$1,163,321
Purchase Details
Closed on
Jul 17, 2003
Sold by
Ks Assoc Inc
Bought by
Laporte Christopher
Home Financials for this Owner
Home Financials are based on the most recent Mortgage that was taken out on this home.
Original Mortgage
$600,000
Interest Rate
5.34%
Mortgage Type
New Conventional
Create a Home Valuation Report for This Property
The Home Valuation Report is an in-depth analysis detailing your home's value as well as a comparison with similar homes in the area
Home Values in the Area
Average Home Value in this Area
Purchase History
| Date | Buyer | Sale Price | Title Company |
|---|---|---|---|
| Tierney Carl J | $1,080,000 | -- | |
| Laporte Christopher | $803,900 | -- |
Source: Public Records
Mortgage History
| Date | Status | Borrower | Loan Amount |
|---|---|---|---|
| Open | Tierney Carl J | $783,000 | |
| Previous Owner | Laporte Christopher | $600,000 |
Source: Public Records
Tax History Compared to Growth
Tax History
| Year | Tax Paid | Tax Assessment Tax Assessment Total Assessment is a certain percentage of the fair market value that is determined by local assessors to be the total taxable value of land and additions on the property. | Land | Improvement |
|---|---|---|---|---|
| 2025 | $14,369 | $1,340,930 | $596,000 | $744,930 |
| 2024 | $14,369 | $1,216,130 | $491,000 | $725,130 |
| 2023 | $12,853 | $1,116,210 | $436,000 | $680,210 |
| 2022 | $12,213 | $1,046,970 | $436,000 | $610,970 |
| 2021 | $12,024 | $1,004,970 | $394,000 | $610,970 |
| 2020 | $12,028 | $996,970 | $386,000 | $610,970 |
| 2019 | $10,997 | $911,520 | $351,000 | $560,520 |
| 2018 | $9,792 | $851,460 | $351,000 | $500,460 |
| 2017 | $9,930 | $838,650 | $348,000 | $490,650 |
| 2016 | $10,214 | $864,470 | $348,000 | $516,470 |
| 2015 | $9,217 | $809,240 | $322,000 | $487,240 |
| 2014 | $8,777 | $772,240 | $285,000 | $487,240 |
Source: Public Records
Map
Nearby Homes
- 6712 Moly Dr
- 6616 Fisher Ave
- 2221 Orchid Dr
- 6613 Fisher Ave
- 2300 Meridian St
- 6703 Hallwood Ave
- 6707 Hallwood Ave
- 6601 Gordon Ave
- 6545 Placid St
- 2202 Grayson Place
- 6610 Quinten St
- 2302 Westmoreland St
- 6616 Kirby Ct
- 6609 Rockmont Ct
- 2125 Hilltop Place
- 2240 Highland Terrace
- 6927 Haycock Rd
- 6607 Midhill Place
- 2231 N Tuckahoe St
- 2118 Greenwich St
- 2223 Casemont Dr
- 6639 Moly Dr
- 2219 Casemont Dr
- 2220 Casemont Dr
- 6637 Moly Dr
- 6640 Moly Dr
- 2226 Casemont Dr
- 2225 Casemont Dr
- 6638 Moly Dr
- 2218 Casemont Dr
- 6703 Moly Dr
- 2217 Casemont Dr
- 2227 Casemont Dr
- 2212 Primrose Dr
- 6636 Moly Dr
- 6633 Moly Dr
- 2214 Primrose Dr
- 2216 Casemont Dr
- 2230 Casemont Dr
- 6705 Moly Dr