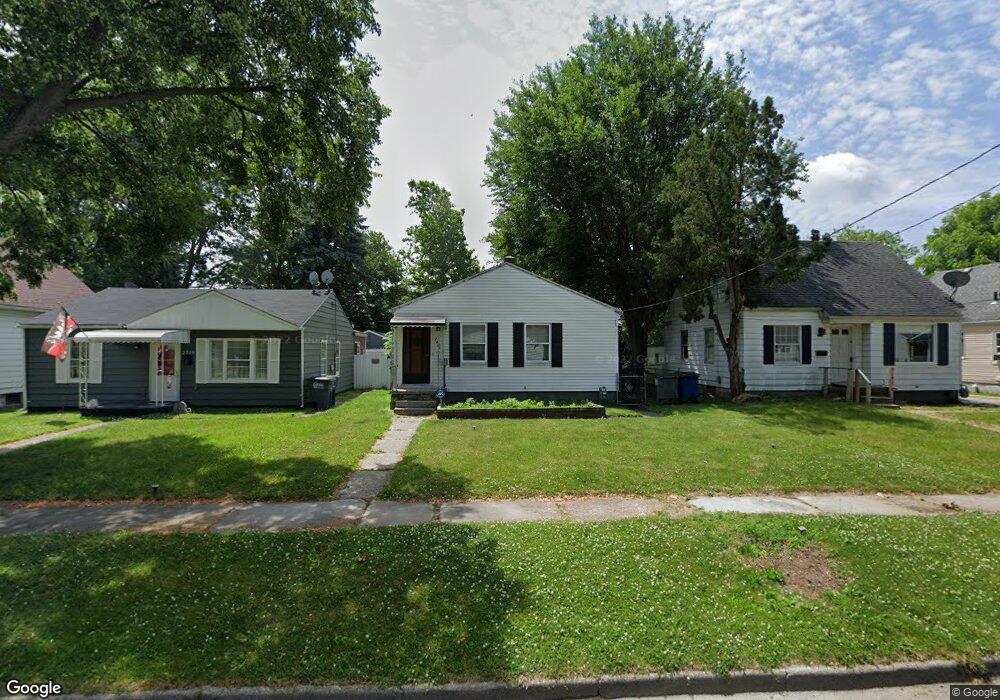
2221 Dunham St Toledo, OH 43609
Southside NeighborhoodEstimated Value: $65,000 - $94,000
2
Beds
1
Bath
725
Sq Ft
$108/Sq Ft
Est. Value
About This Home
This home is located at 2221 Dunham St, Toledo, OH 43609 and is currently estimated at $78,383, approximately $108 per square foot. 2221 Dunham St is a home located in Lucas County with nearby schools including Burroughs Elementary School, Bowsher High School, and Explorers Academy of Science and Technology.
Ownership History
Date
Name
Owned For
Owner Type
Purchase Details
Closed on
Aug 5, 1999
Sold by
Binkowski Sharon
Bought by
Polcyn George J
Current Estimated Value
Home Financials for this Owner
Home Financials are based on the most recent Mortgage that was taken out on this home.
Original Mortgage
$39,000
Outstanding Balance
$11,312
Interest Rate
7.77%
Estimated Equity
$67,071
Purchase Details
Closed on
Jul 12, 1999
Sold by
Estate Of George V Polcyn
Bought by
Polcyn George J and Polcyn Susan
Home Financials for this Owner
Home Financials are based on the most recent Mortgage that was taken out on this home.
Original Mortgage
$39,000
Outstanding Balance
$11,312
Interest Rate
7.77%
Estimated Equity
$67,071
Create a Home Valuation Report for This Property
The Home Valuation Report is an in-depth analysis detailing your home's value as well as a comparison with similar homes in the area
Home Values in the Area
Average Home Value in this Area
Purchase History
| Date | Buyer | Sale Price | Title Company |
|---|---|---|---|
| Polcyn George J | $7,300 | Perrysburg Title Agency Inc | |
| Polcyn George J | $15,500 | Perrysburg Title Agency Inc | |
| Polcyn George J | $9,600 | Perrysburg Title Agency Inc | |
| Polcyn George J | -- | -- |
Source: Public Records
Mortgage History
| Date | Status | Borrower | Loan Amount |
|---|---|---|---|
| Open | Polcyn George J | $39,000 |
Source: Public Records
Tax History Compared to Growth
Tax History
| Year | Tax Paid | Tax Assessment Tax Assessment Total Assessment is a certain percentage of the fair market value that is determined by local assessors to be the total taxable value of land and additions on the property. | Land | Improvement |
|---|---|---|---|---|
| 2024 | $587 | $16,800 | $5,950 | $10,850 |
| 2023 | $1,198 | $16,660 | $3,780 | $12,880 |
| 2022 | $1,189 | $16,660 | $3,780 | $12,880 |
| 2021 | $1,182 | $16,660 | $3,780 | $12,880 |
| 2020 | $1,285 | $15,890 | $3,570 | $12,320 |
| 2019 | $1,248 | $15,890 | $3,570 | $12,320 |
| 2018 | $1,232 | $15,890 | $3,570 | $12,320 |
| 2017 | $1,297 | $15,540 | $3,500 | $12,040 |
| 2016 | $1,267 | $44,400 | $10,000 | $34,400 |
| 2015 | $1,222 | $44,400 | $10,000 | $34,400 |
| 2014 | $977 | $15,540 | $3,500 | $12,040 |
| 2013 | $977 | $15,540 | $3,500 | $12,040 |
Source: Public Records
Map
Nearby Homes
- 304 Mayberry St
- 321 Mayberry St
- 2126 Airport Hwy
- 226 Somerset St
- 221 Somerset St
- 440 Somerset St
- 556 Apple Ave
- 224 S Fearing Blvd
- 531 Shasta Dr
- 576 Bronx Dr
- 142 S Detroit Ave
- 512 Woodsdale Ave
- 140 Whiting Ave
- 1754 Finch St
- 1777 South Ave
- 710 Durango Dr
- 2828 South Ave
- 649 Wright Ave
- 705 Wright Ave
- 885 National Ave